Candlestick patterns are a key part of trading. They are like a special code on a chart that shows how prices are moving. Imagine each pattern as a hint about what might happen next in the stock market.
History of Candlestick Charting
Candlestick charting started over 200 years ago in Japan with rice traders. A smart trader named Munehisa Homma first used it. He saw that prices didn’t just change because of supply and demand, but also because of how traders felt. This idea led to the birth of candlestick charts. Much later, a man named Steve Nison introduced these charts to the Western world.
Why Candlestick Patterns Matter in Trading
Candlestick patterns are like a quick snapshot of the market’s mood. Each pattern is made of candles, and every candle tells a story about the price – where it opened, where it closed, how high and low it went. This helps traders guess if prices might go up or down.
Think of it this way: If you see a pattern that usually means prices will go up, you might decide to buy. If you see one that means prices might go down, you might sell. These patterns work for all kinds of trading – whether you’re looking at prices every day or once in a while.
In short, candlestick patterns are important because they help traders understand the market better and make smarter decisions.
Basics of Candlestick Patterns
Candlestick patterns are made up of individual “candles,” each showing the price movement for a certain time period. Let’s break down the basics:
Basic Components of a Candlestick
- Body: The thick part of the candle. It shows the difference between the opening and closing prices. If the close is higher than the open, the body is often colored in (or black), showing prices went up. If the close is lower, the body might be empty (or white), showing prices went down.
- Shadow: These are the thin lines above and below the body. They show the highest and lowest prices during that time period. The top shadow shows the high, and the bottom shadow shows the low.
- Open: This is where the price started at the beginning of the time period. It’s either the top or bottom of the body, depending on whether prices went up or down.
- Close: This is where the price ended at the end of the time period. Like the open, it’s at the top or bottom of the body.
- High: The peak point of the top shadow. It’s the highest price in that time period.
- Low: The bottom of the lower shadow. It’s the lowest price in that time period.
Bullish and Bearish Candles
- Bullish Candles: These are candles where the closing price is higher than the opening price. They suggest that buyers are in control and prices might go up. They are often colored in or black.
- Bearish Candles: These are candles where the closing price is lower than the opening price. They suggest that sellers are in control and prices might go down. They are often empty or white.
Types of Candlestick Patterns
Candlestick patterns can be grouped into four main types based on how many candles they consist of. Each type can tell us something different about the market.
Single Candlestick Patterns
These are formed by just one candle. They can give quick signals about the market’s mood. Examples include:
- Bearish Marubozu
- Bullish Marubozu
- Inside Bar
- Shooting Star
- Inverted Hammer
- Gravestone Doji
- Dragonfly Doji
- Doji Star
- Doji Candlestick
- Spinning Top
- Long Legged Doji
- Takuri Candlestick
- Closing Marubozu
- Hammer
- Hanging Man
- Key Reversal Bar
- Bullish Belt Hold
- Harami Cross
- High Wave
- Kicking Candlestick
- Short Line
- Cradle Candlestick
Double Candlestick Patterns
These patterns are made up of two candles and often signal stronger market moves than single patterns. Examples include:
- Dark Cloud Cover
- Bearish Engulfing
- Bullish Engulfing
- Piercing Line
- Thrusting Candlestick
- Matching Low
- In-neck Candlestick
- On-neck Candlestick
- Stick Sandwich
- Above The Stomach
Triple Candlestick Patterns
These are formed by three candles and are usually stronger indicators than single or double patterns. Examples include:
- Bullish Morning Doji Star
- Bearish Evening Doji Star
- Three Black Crows
- Abandoned Baby Candlestick
- Three Inside Down
- Three Inside Up
- Three-Line Strike
- Three Outside Up
- Three Outside Down
- Three Stars in the South
- Island Reversal
- Three White Soldiers
- Stalled Candlestick
Complex Candlestick Patterns
These are formed by more than three candles and are usually stronger indicators than single or double patterns. Examples include:
- Falling Three Methods
- Rising Three Methods
- Hikkake Candlestick
- Separating Lines
- Mat Hold
- The Modified Hikkake
- Upside Gap Three Methods
- Downside Gap Three Methods
- Tasuki Gap
- Breakaway Candlestick
- Advance Block Candlestick
- Ladder Top
- Ladder Bottom Candlestick
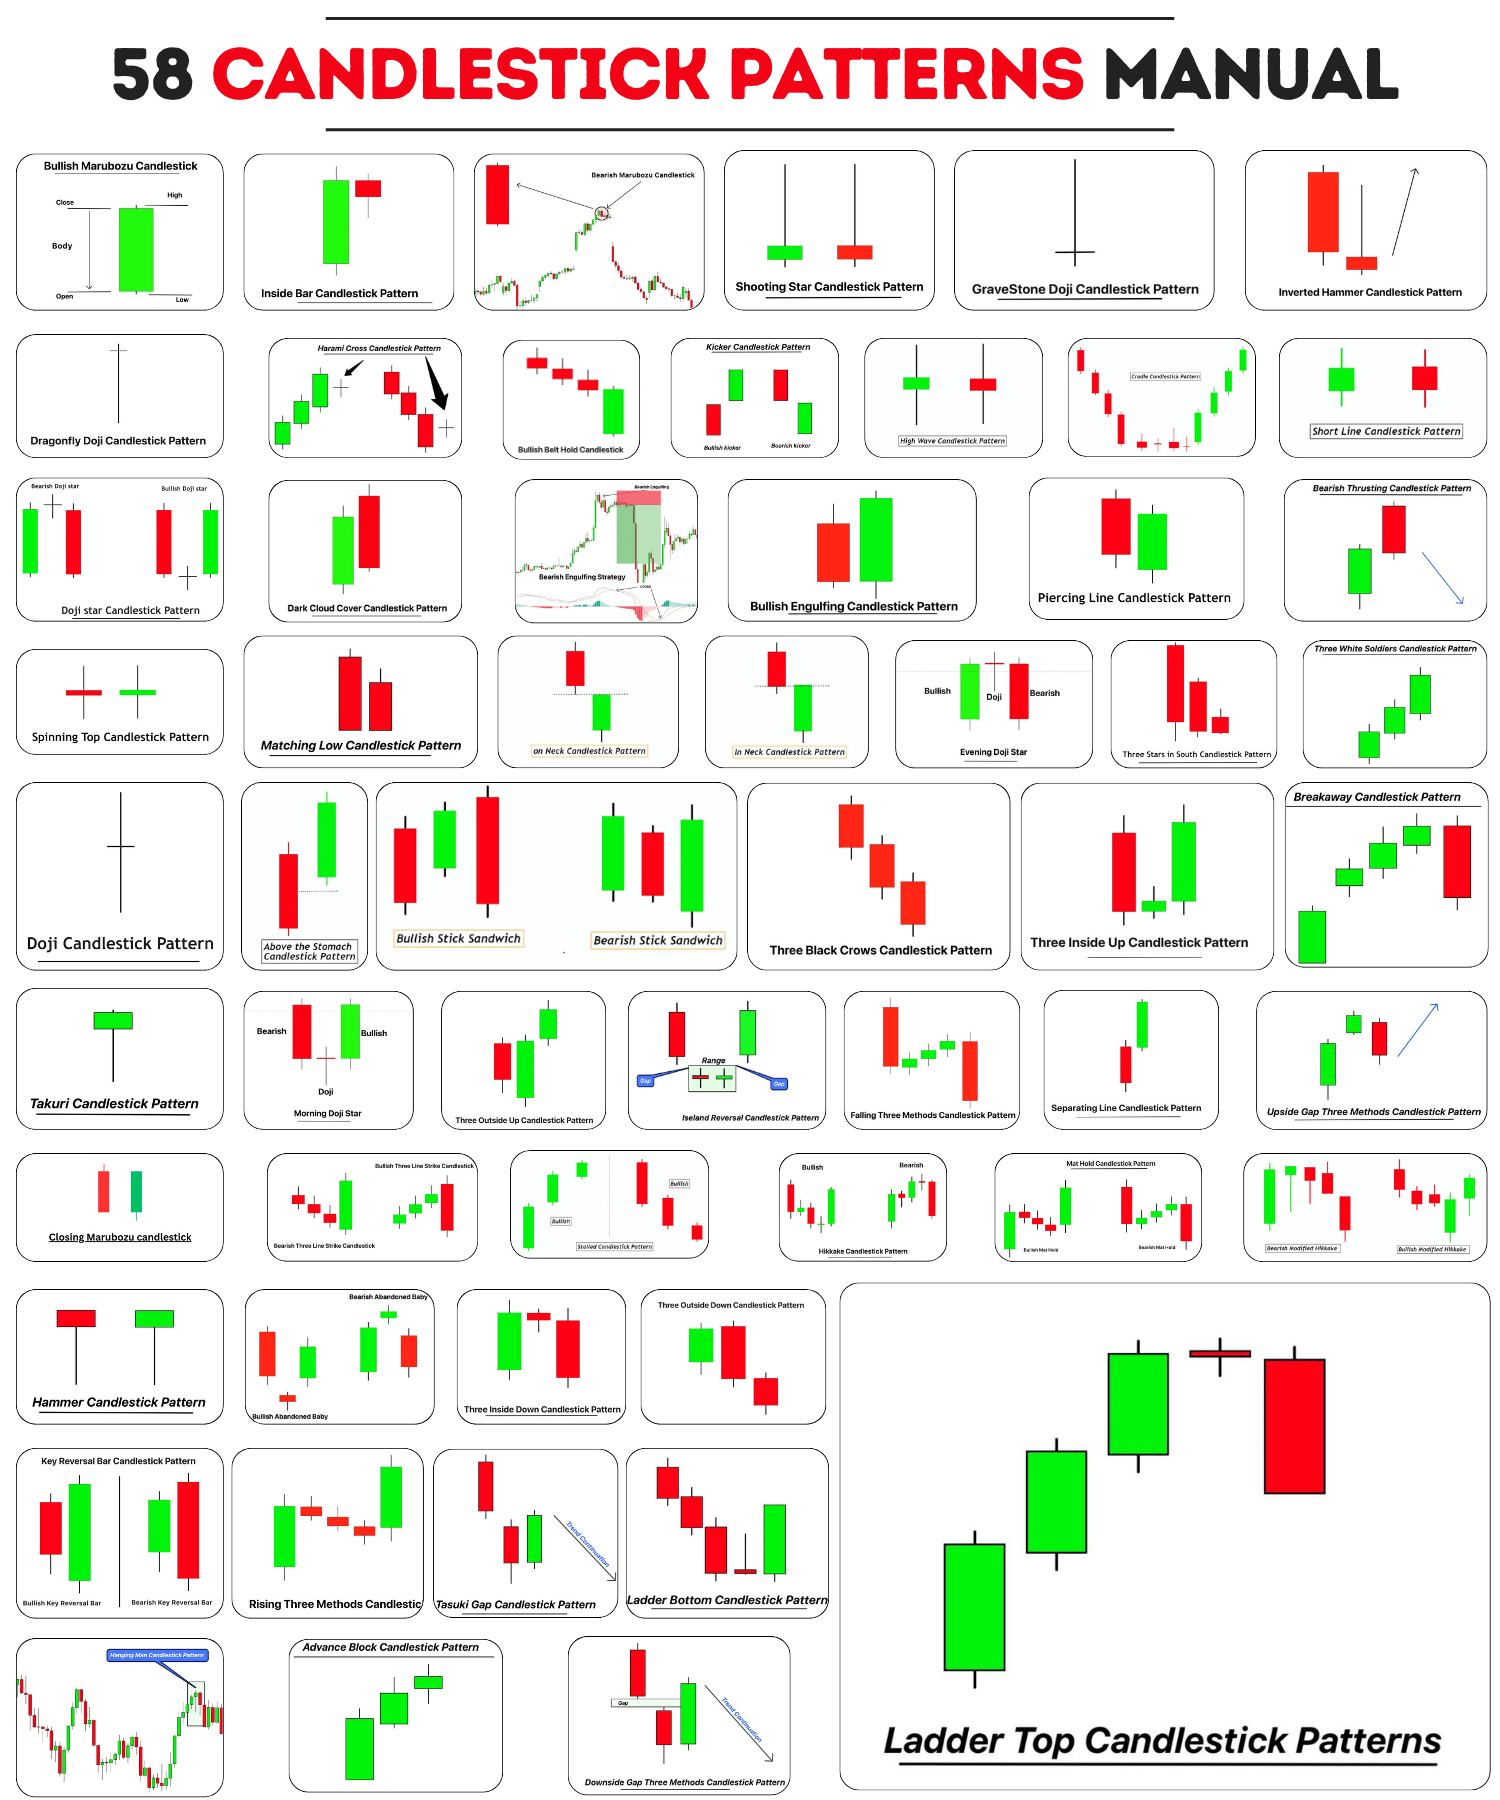
List of 58 candlestick patterns
Here’s the explanation of each candlestick pattern, along with the trend and signal generated by each candlestick pattern. i have explained almost all the candlestick patterns.
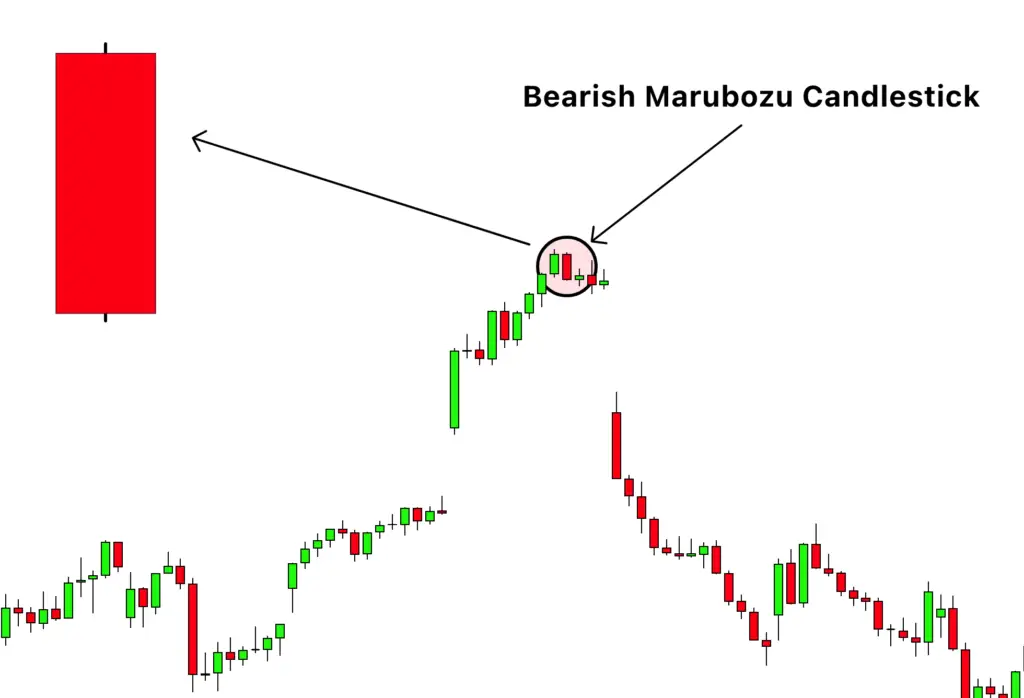
1. Bearish Marubozu Candlestick Pattern
- Definition: The Bearish Marubozu Candlestick Pattern is a long, dark candle with no wicks, indicating that the market opened at its high and closed at its low, reflecting strong selling pressure throughout the period.
- Signal: Indicates a continuation of the current downtrend.
- Trend: Suggests a strong bearish sentiment.
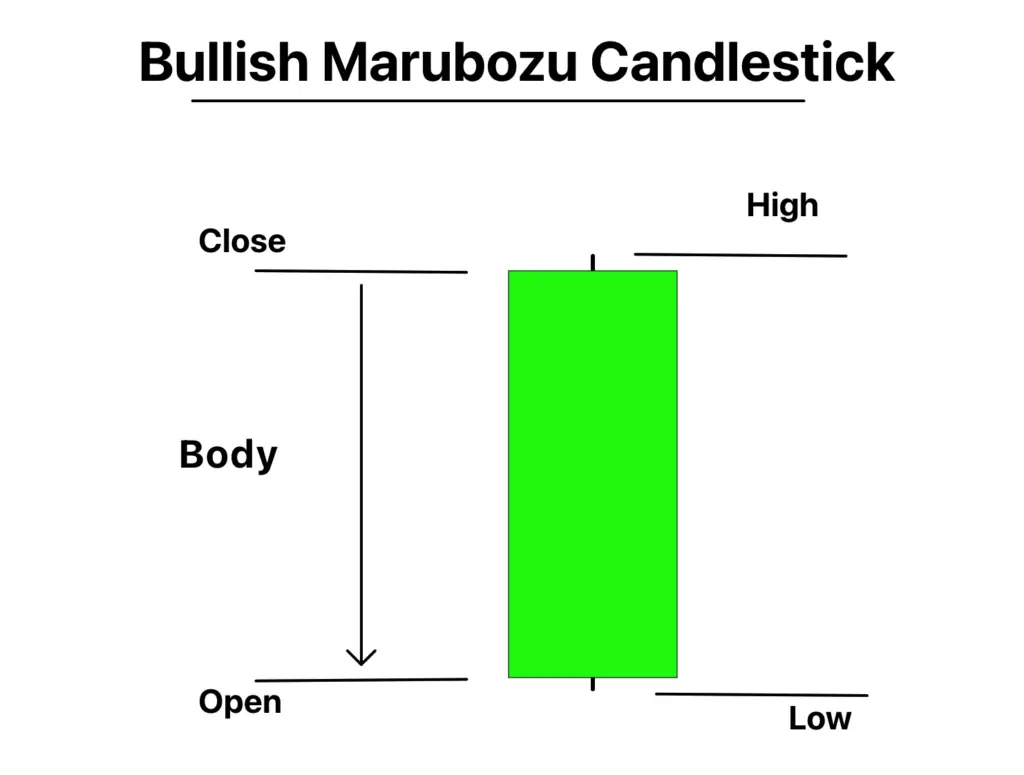
2. Bullish Marubozu Candlestick Pattern
- Definition: The Bullish Marubozu Candlestick Pattern is a long, full-bodied candle without upper or lower shadows, showing that the market opened at its low and closed at its high, signifying strong buying pressure.
- Signal: Indicates a continuation of the current uptrend.
- Trend: Suggests a strong bullish momentum.
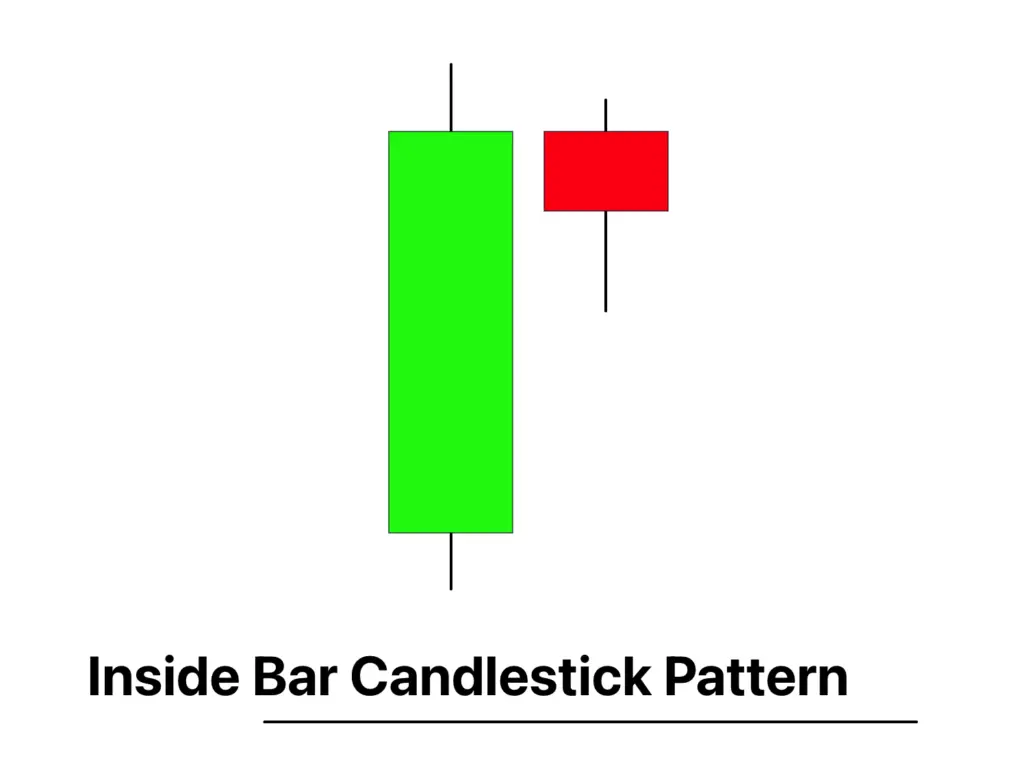
3. Inside Bar Candlestick Pattern
- Definition: The Inside Bar Candlestick Pattern consists of a smaller candlestick completely contained within the range of the previous, larger candle, representing a period of consolidation or indecision.
- Signal: Often signals a potential breakout in either direction.
- Trend: Can be found in both uptrends and downtrends as a continuation signal.
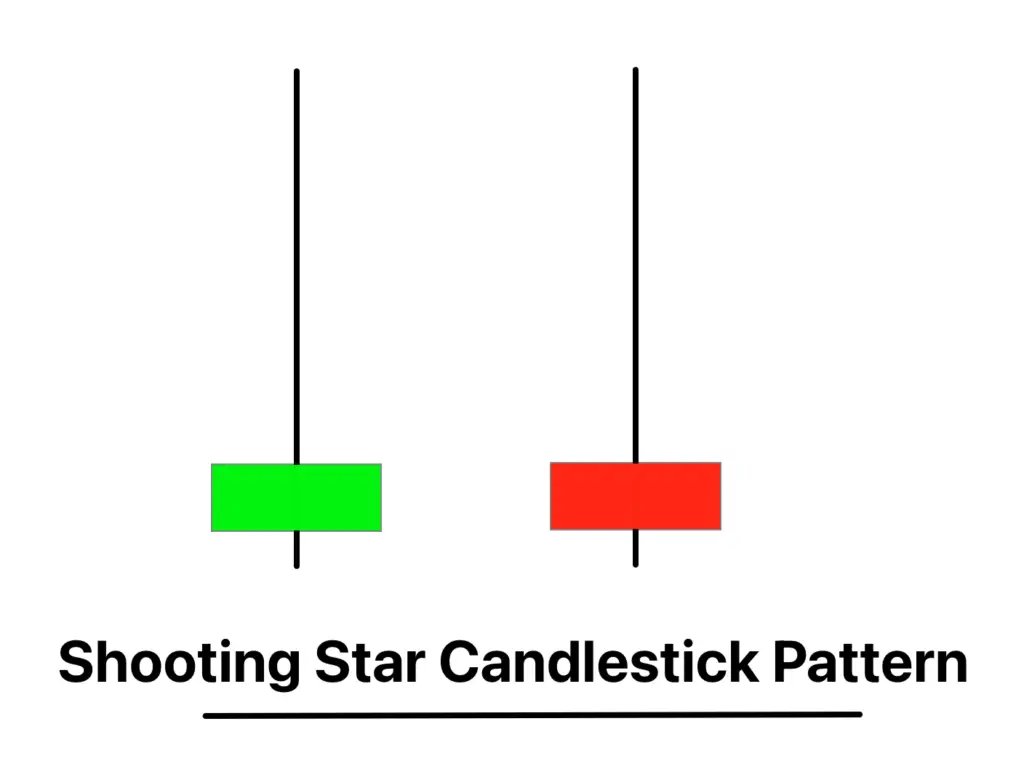
4. Shooting Star Candlestick Pattern
- Definition: The Shooting Star Candlestick Pattern is a bearish candlestick with a long upper shadow and a small lower body, appearing after an uptrend, suggesting that buyers attempted but failed to push the market higher.
- Signal: Signals a potential bearish reversal.
- Trend: Often marks the end of an uptrend.
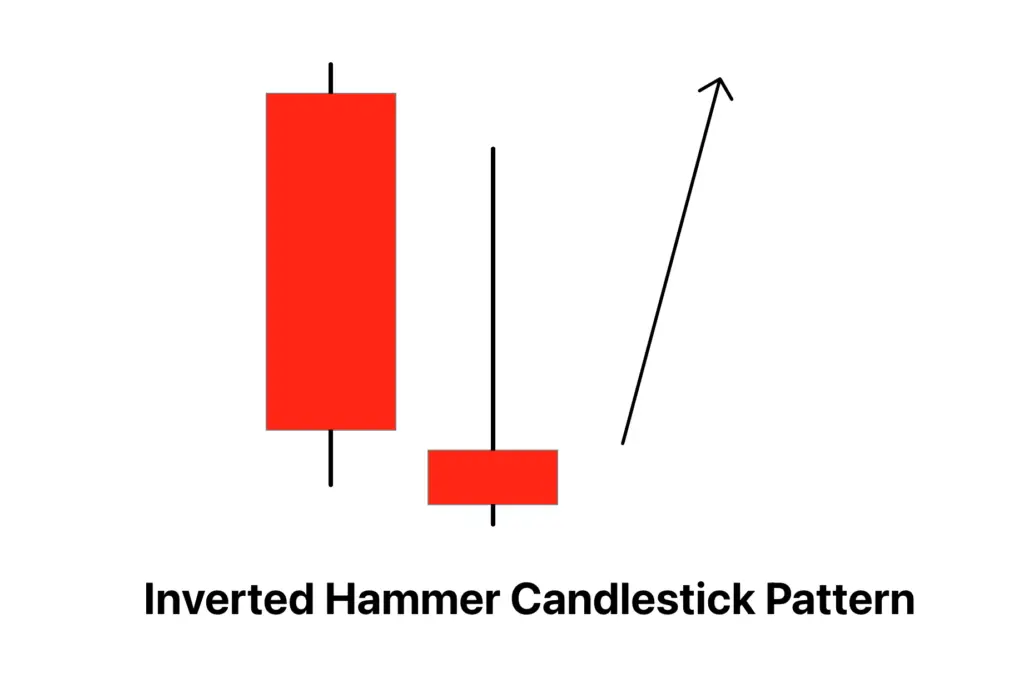
5. Inverted Hammer Candlestick Pattern
- Definition: The Inverted Hammer Candlestick Pattern is a bullish candlestick that appears during a downtrend, characterized by a long upper shadow and small lower body, indicating that buyers attempted to push the price up.
- Signal: Suggests a potential reversal of the downtrend.
- Trend: Often signals the start of a bullish reversal.
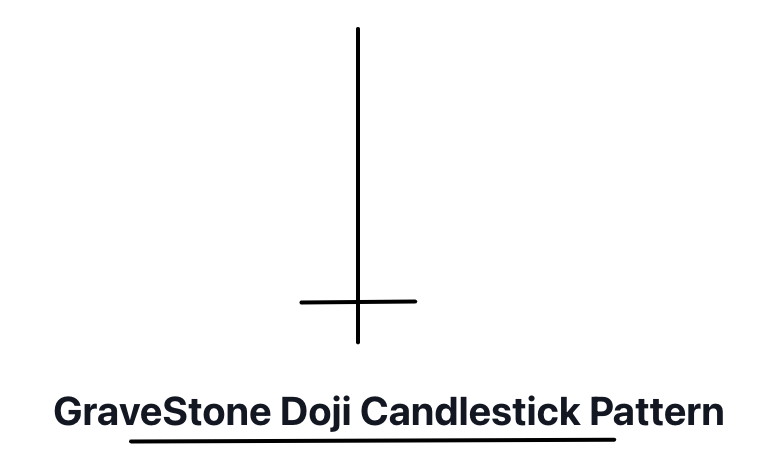
6. Gravestone Doji Candlestick Pattern
- Definition: The Gravestone Doji Candlestick Pattern features a long upper shadow and no lower shadow, where the open, low, and close prices are the same, typically occurring at the top of an uptrend.
- Signal: Indicates a reversal from bullish to bearish sentiment.
- Trend: Often marks the start of a bearish reversal.
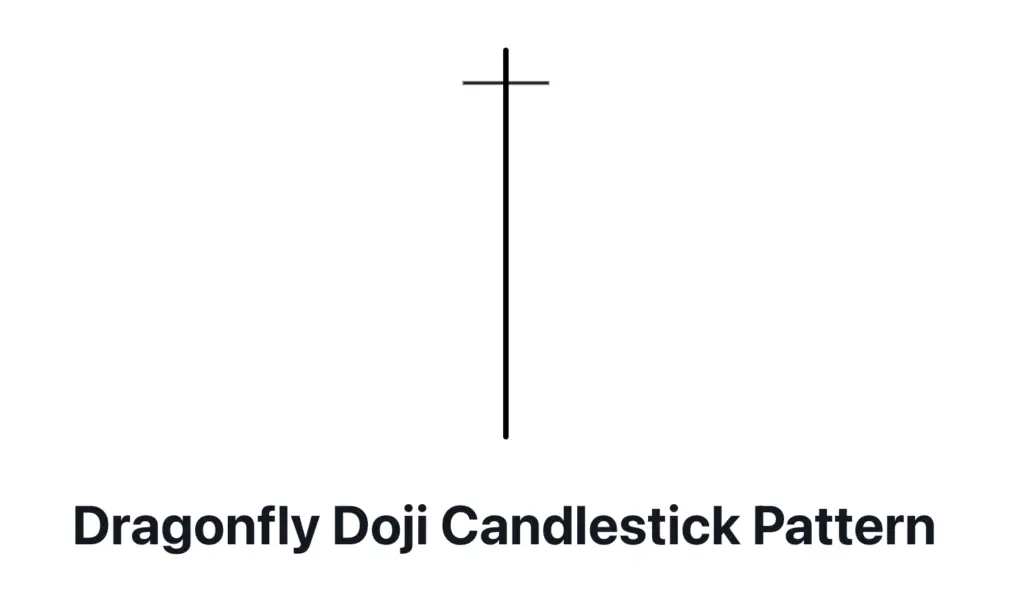
7. Dragonfly Doji Candlestick Pattern
- Definition: The Dragonfly Doji Candlestick Pattern has a long lower shadow and no upper shadow, with the open, high, and close prices at the same level, suggesting that sellers drove prices down, but buyers pushed it back up.
- Signal: Indicates a potential bullish reversal.
- Trend: Typically occurs at the bottom of a downtrend.
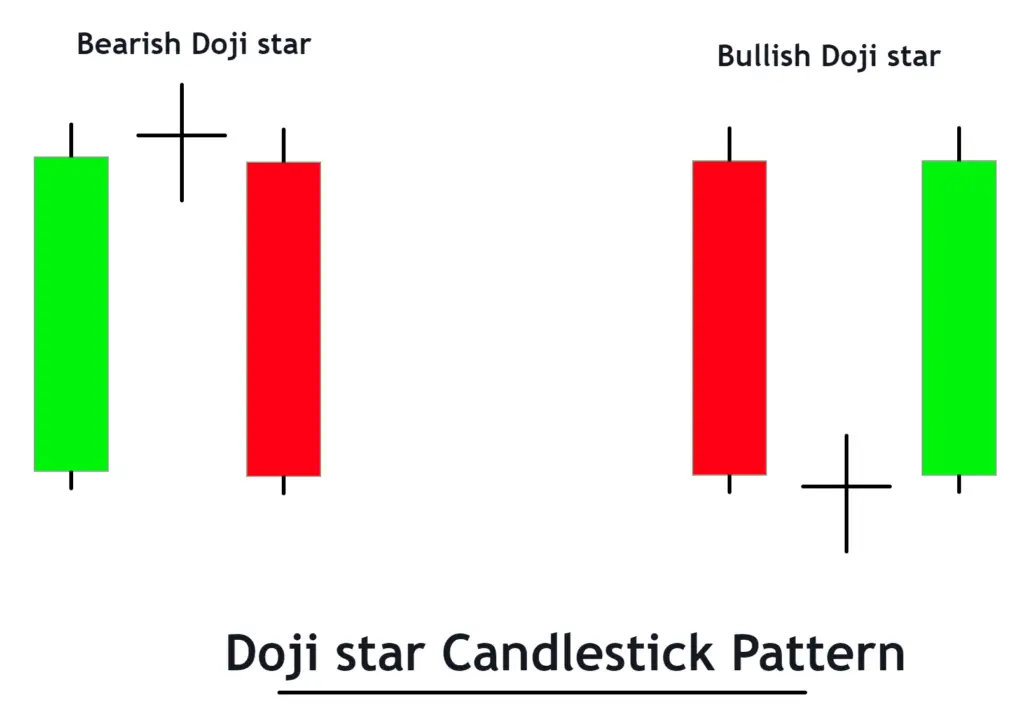
8. Doji Star Candlestick Pattern
- Definition: The Doji Star Candlestick Pattern is characterized by a small or nonexistent body with open and close prices near the same, reflecting market indecision after a strong trend.
- Signal: Can signal a potential reversal if it follows a long bullish or bearish trend.
- Trend: Useful in identifying turning points in both uptrends and downtrends.
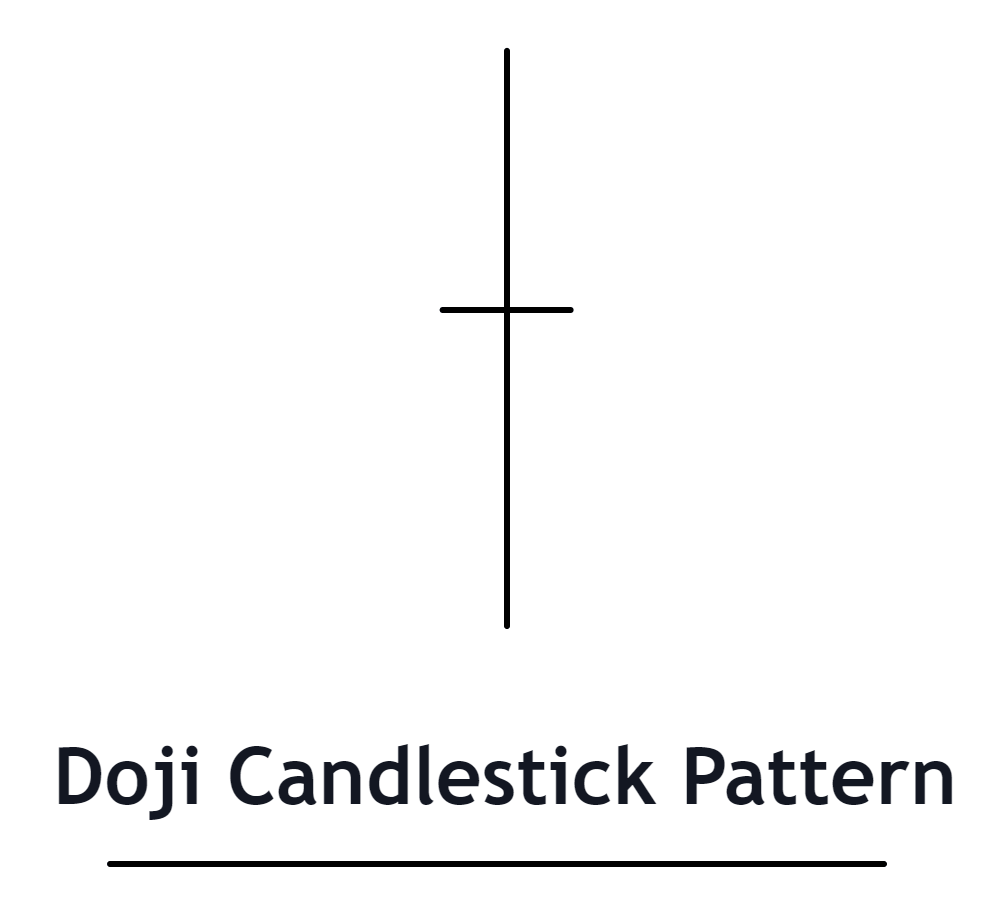
9. Doji Candlestick Pattern
- Definition: The Doji Candlestick Pattern is marked by a very small or nonexistent body, showing a balance between buying and selling pressures, leading to an open and close at or very near the same price.
- Signal: Often signals market indecision that can precede a significant price movement.
- Trend: Appears in both bullish and bearish markets.
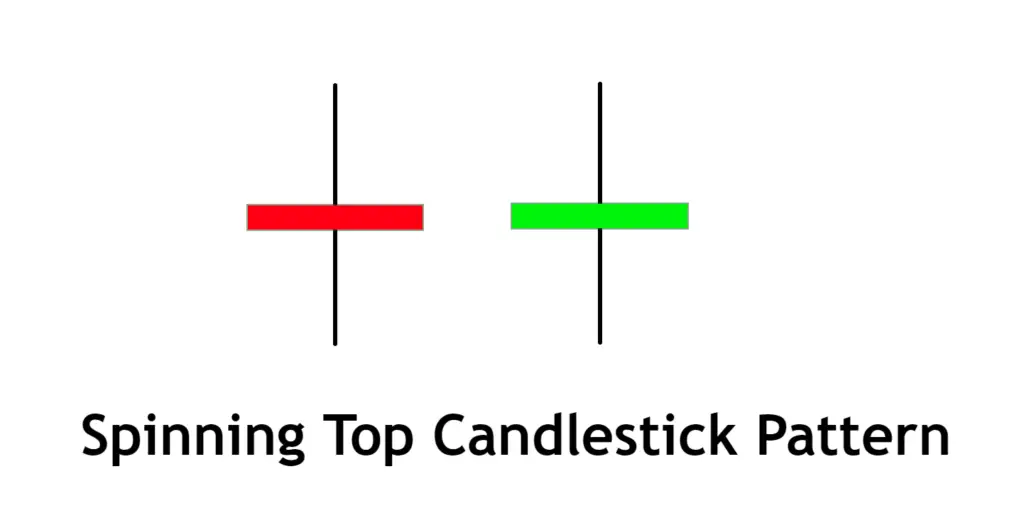
10. Spinning Top Candlestick Pattern
- Definition: The Spinning Top Candlestick Pattern consists of a small body with long upper and lower shadows, indicating significant indecision in the market.
- Signal: Suggests uncertainty and, following a strong trend, potential reversal.
- Trend: Appears in both uptrends and downtrends.
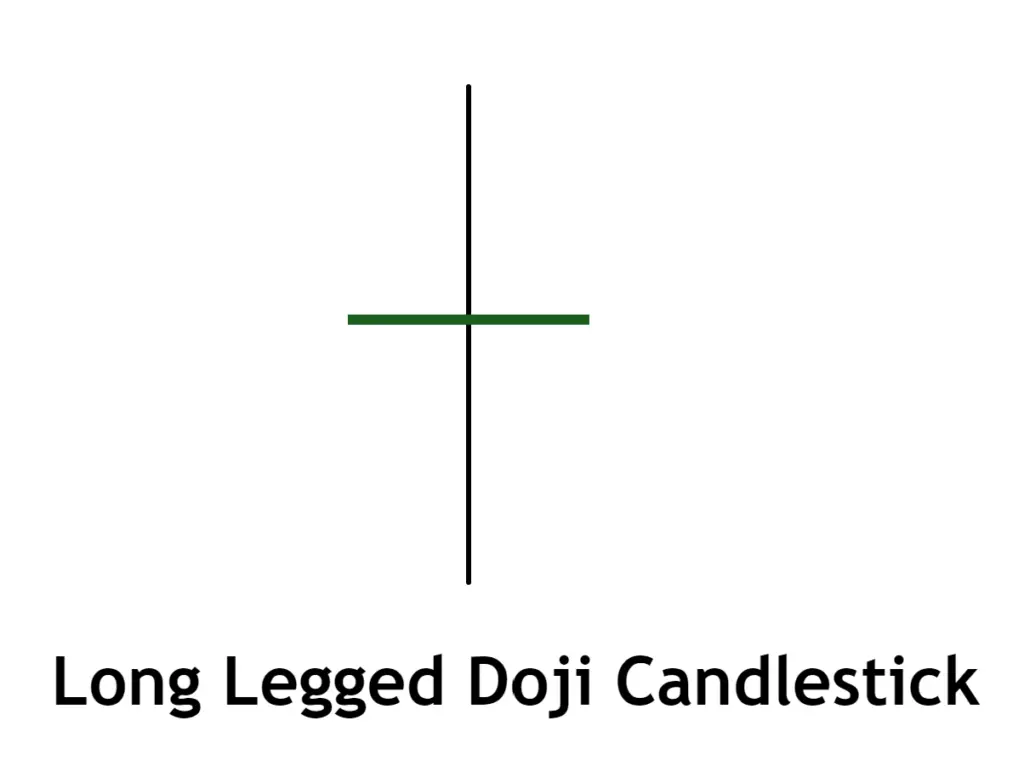
11. Long Legged Doji Candlestick Pattern
- Definition: This pattern features a small or nonexistent body with very long upper and lower shadows, reflecting a highly volatile session with significant indecision.
- Signal: Indicates a potential turning point in the market.
- Trend: Often seen at market tops and bottoms, signaling possible reversals.
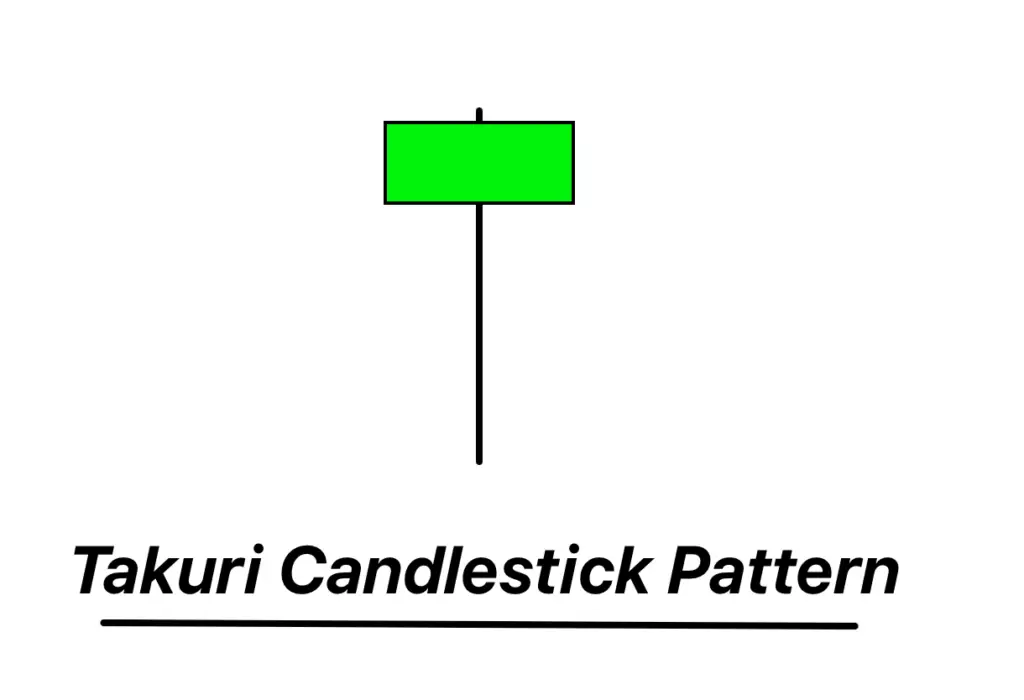
12. Takuri Candlestick Pattern
- Definition: The Takuri Candlestick Pattern has a small body with a very long lower shadow and short or no upper shadow, suggesting that the market is testing for a bottom in a downtrend.
- Signal: Indicates that buyers are starting to take control, possibly leading to a bullish reversal.
- Trend: Typically found in downtrends and can signal a shift to an uptrend.
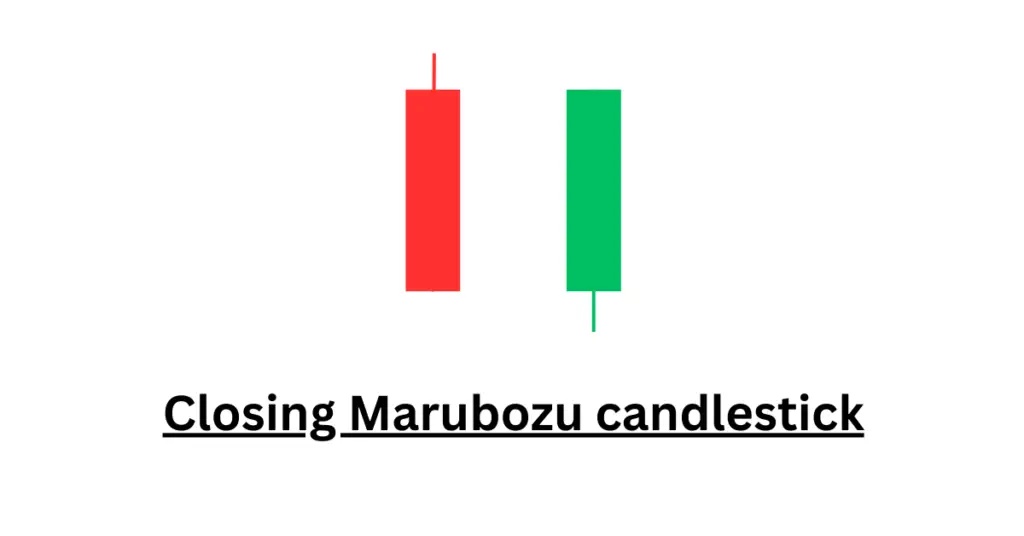
13. Closing Marubozu Candlestick Pattern
- Definition: The Closing Marubozu Candlestick Pattern is a long candle with no or a very short upper shadow and no lower shadow. If bullish, it closes at its high; if bearish, at its low. This pattern indicates a strong commitment from buyers or sellers throughout the trading session.
- Signal: Suggests a strong continuation in the direction of the candle (bullish or bearish).
- Trend: Often used to confirm the current trend’s strength.
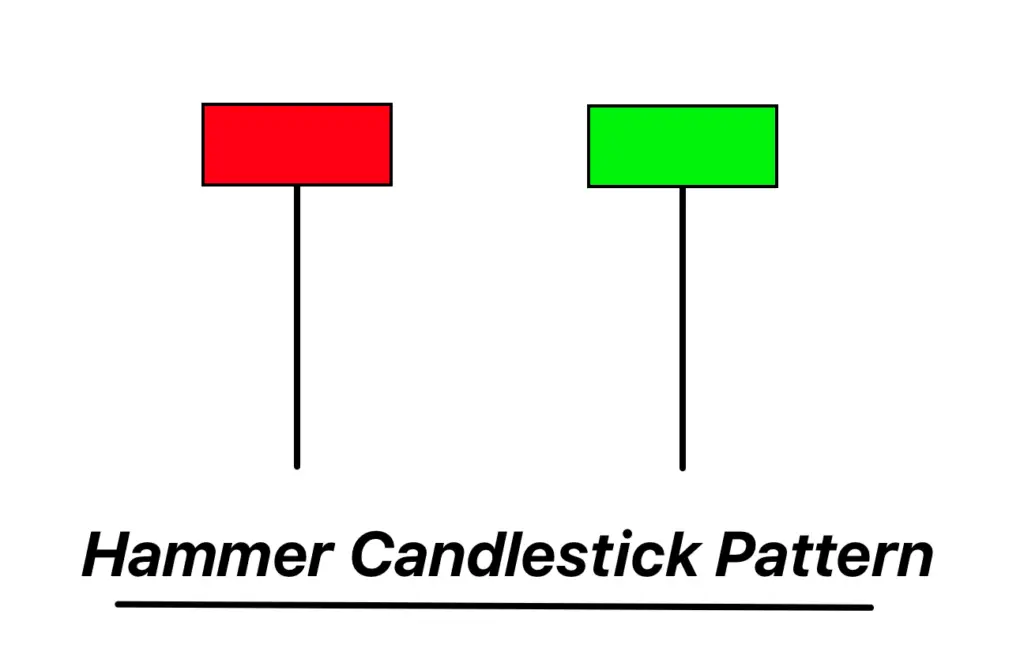
14. Hammer Candlestick Pattern
- Definition: The Hammer Candlestick Pattern appears during a downtrend and features a small body at the top with a long lower shadow and little or no upper shadow, resembling a hammer. It suggests that although selling pressure was present, buyers managed to drive the prices back up.
- Signal: Indicates a potential bullish reversal.
- Trend: Typically signals the end of a downtrend.
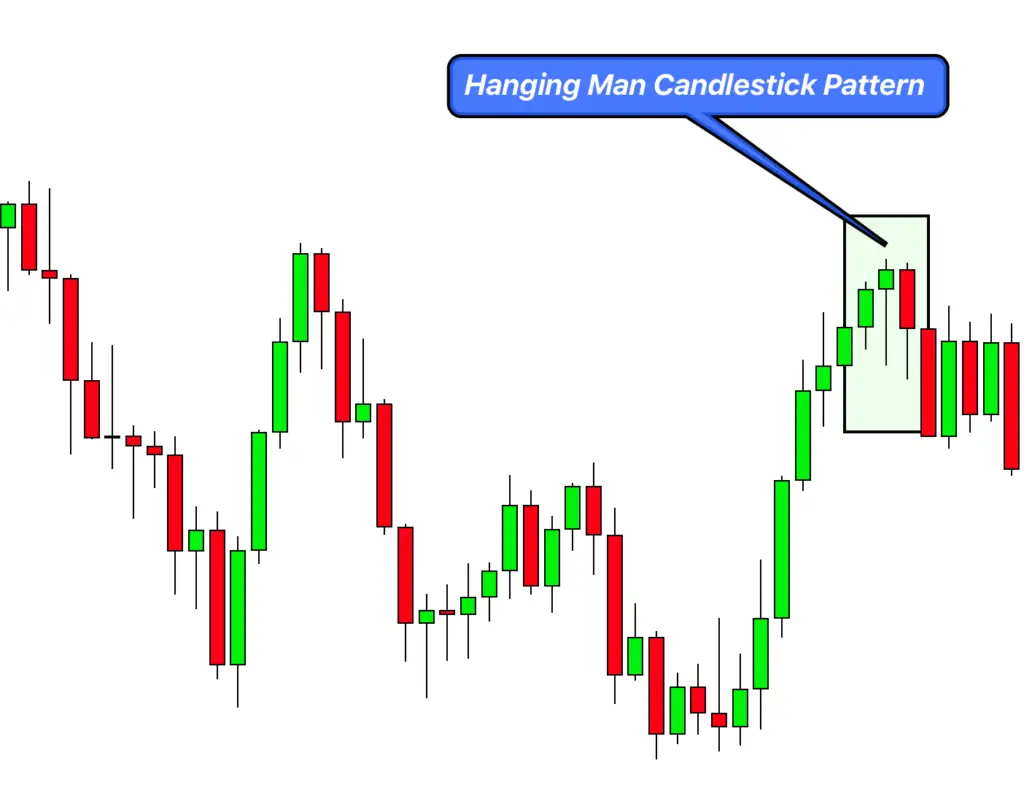
15. Hanging Man Candlestick Pattern
- Definition: The Hanging Man Candlestick Pattern, similar in appearance to the Hammer, occurs at the end of an uptrend. It has a small body at the upper end with a long lower shadow and little or no upper shadow, indicating that selling pressure is starting to increase.
- Signal: Signals a potential bearish reversal.
- Trend: Often marks the beginning of a potential downtrend.
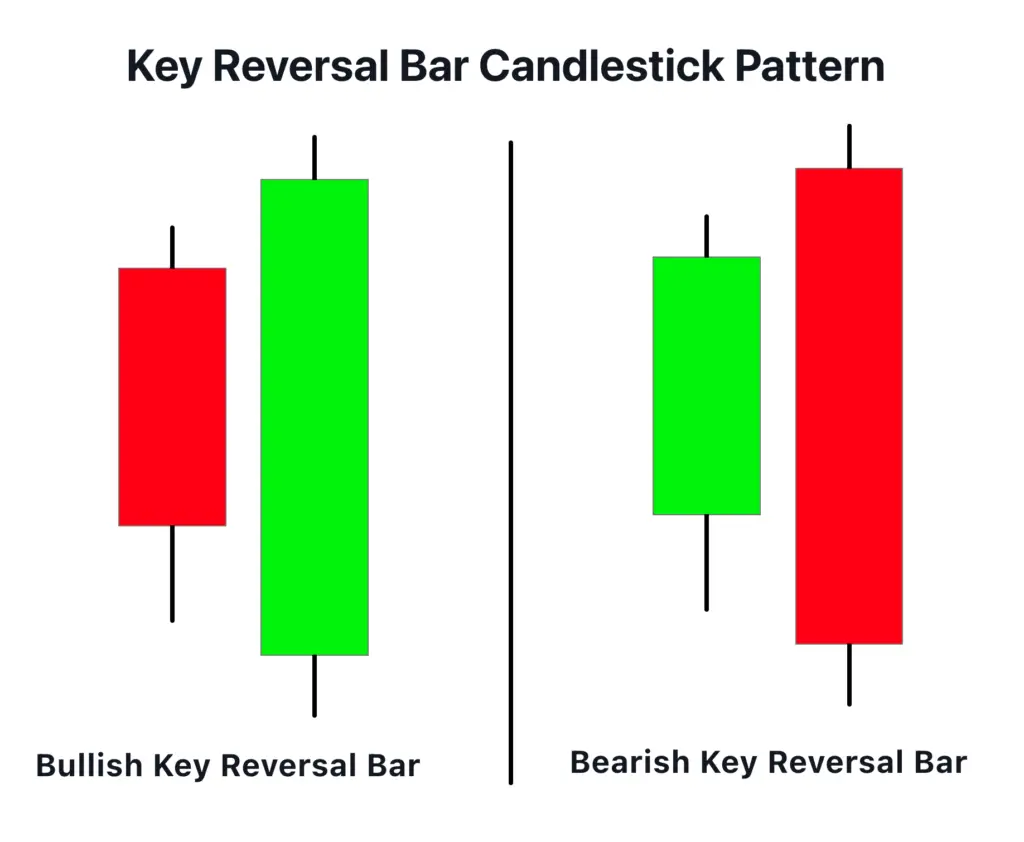
16. Key Reversal Bar Candlestick Pattern
- Definition: The Key Reversal Bar Candlestick Pattern is a single bar pattern that shows a sharp reversal. It occurs when a candle has a higher high and a lower low than the previous candle, but closes in the opposite direction.
- Signal: Indicates a significant shift in market sentiment.
- Trend: Suggests a potential trend reversal.
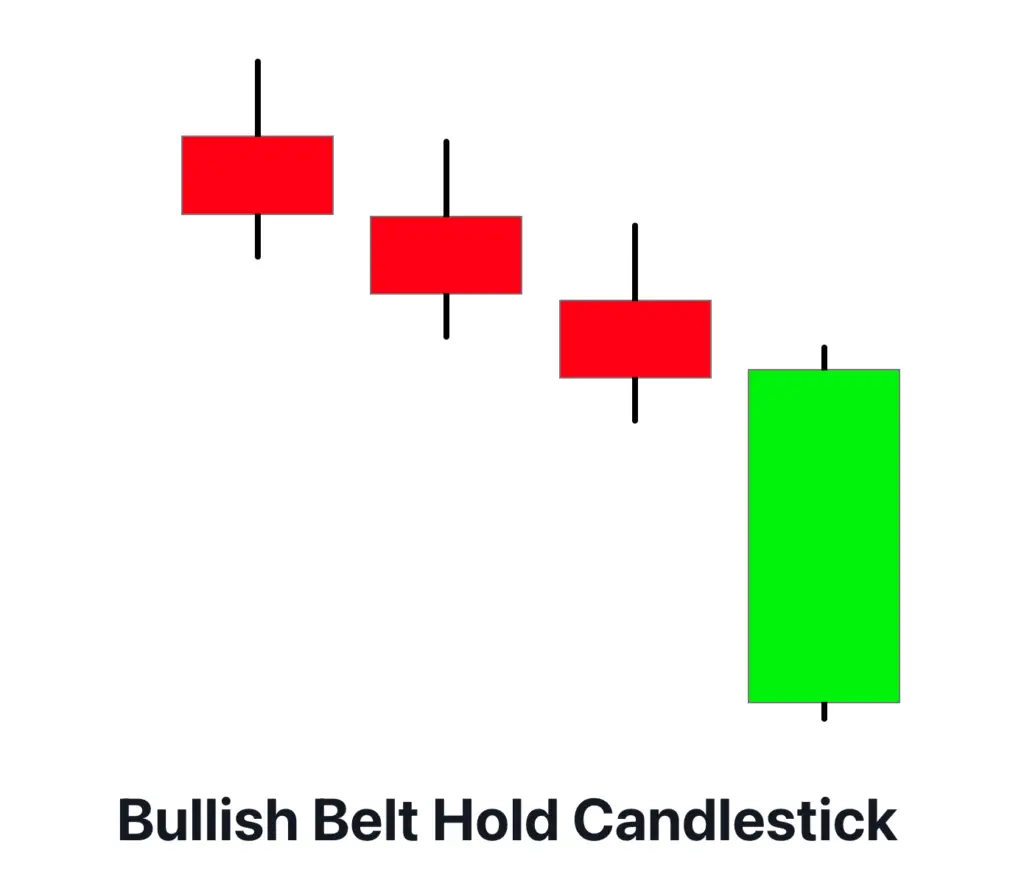
17. Bullish Belt Hold Candlestick Pattern
- Definition: The Bullish Belt Hold Candlestick Pattern is a large bullish candle that opens at its low and closes near its high with little or no upper shadow and no lower shadow. It typically occurs during a downtrend.
- Signal: Indicates a strong bullish reversal.
- Trend: Often marks the beginning of a bullish trend.
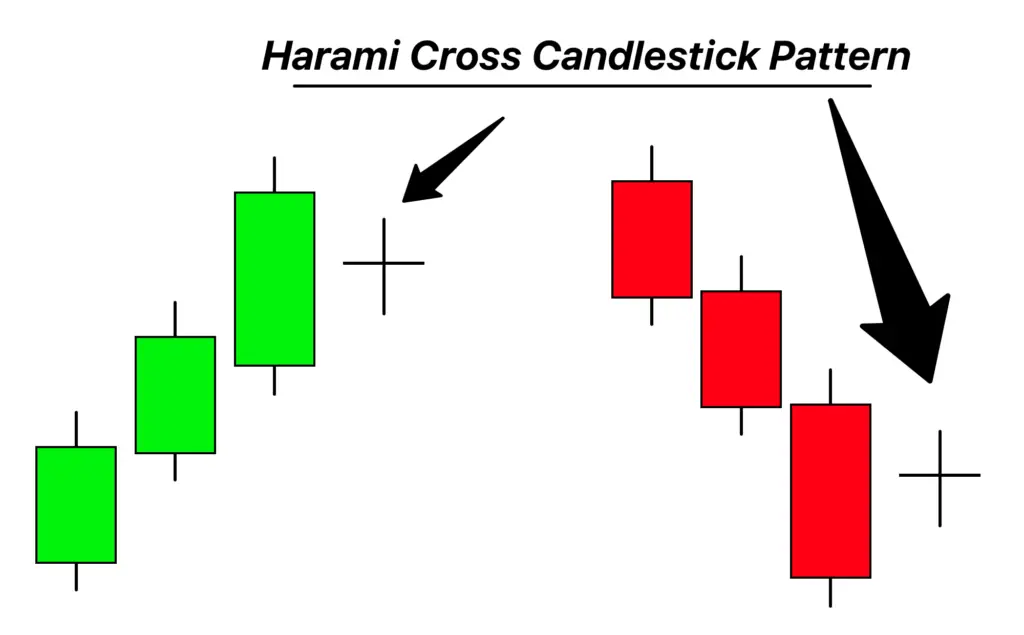
18. Harami Cross Candlestick Pattern
- Definition: The Harami Cross Candlestick Pattern is a two-day pattern where a small doji candle follows a large-bodied candle. The doji is completely contained within the range of the previous body, indicating a significant shift in market sentiment from the previous trend.
- Signal: Suggests indecision and potential reversal of the current trend.
- Trend: Can occur in both uptrends and downtrends.
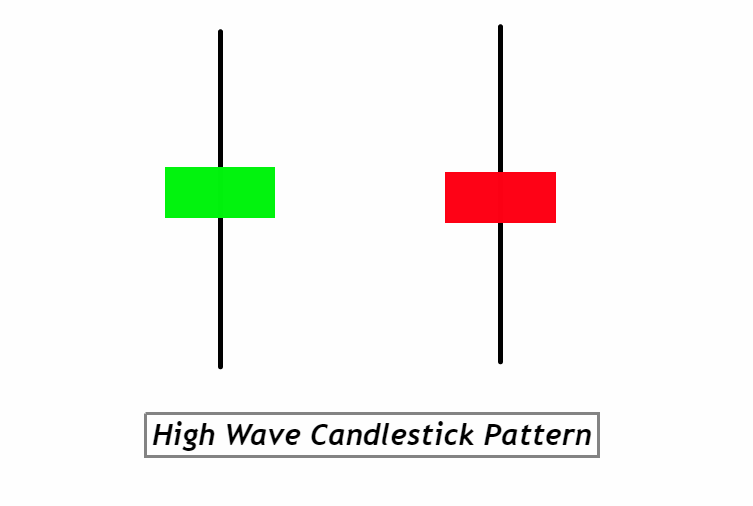
19. High Wave Candlestick Pattern
- Definition: The High Wave Candlestick Pattern is characterized by a small body with long upper and lower shadows, indicating extreme uncertainty and volatility in the market.
- Signal: Signals indecision and potential reversal if it appears after a consistent trend.
- Trend: Appears in both bullish and bearish markets.
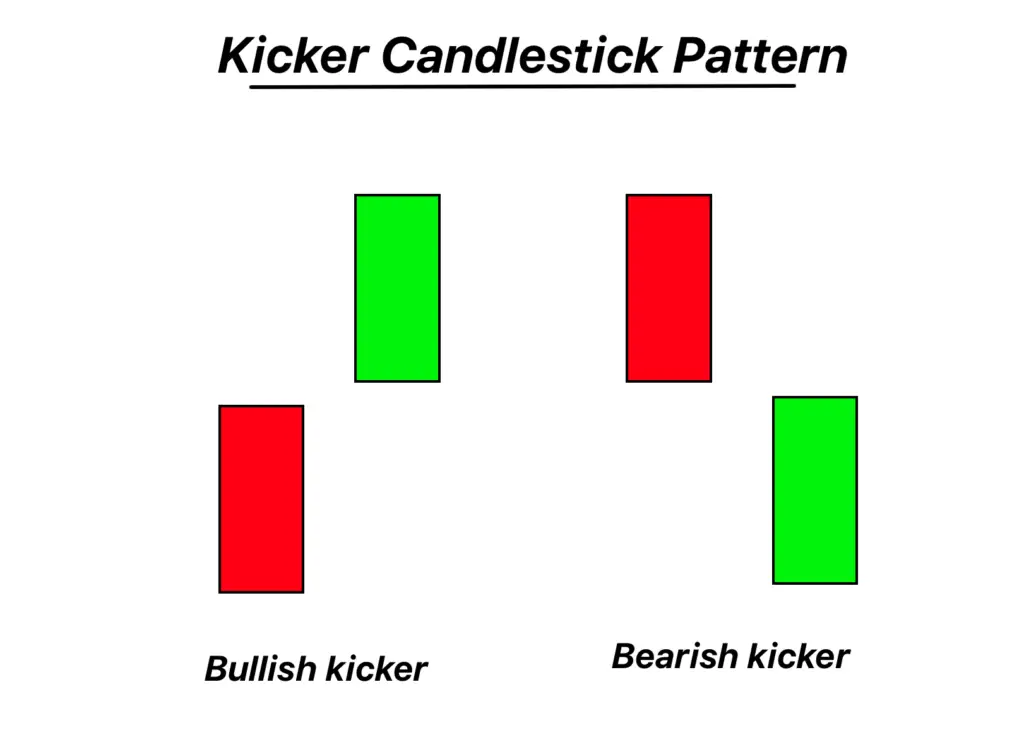
20. Kicking Candlestick Pattern
- Definition: The Kicking Candlestick Pattern consists of two marubozu candles of opposite colors. The first is usually part of the current trend, and the second, a gap away, signals a sudden and strong shift in the opposite direction.
- Signal: Indicates a very strong reversal.
- Trend: Can signal a change in trend direction.
21. Short Line Candlestick Pattern
- Definition: The Short Line Candlestick Pattern is a short candle that appears as a small body with short shadows. It represents a period of low trading volume and little price movement.
- Signal: Suggests a pause in the current trend or a period of consolidation.
- Trend: Can appear in both bullish and bearish trends.

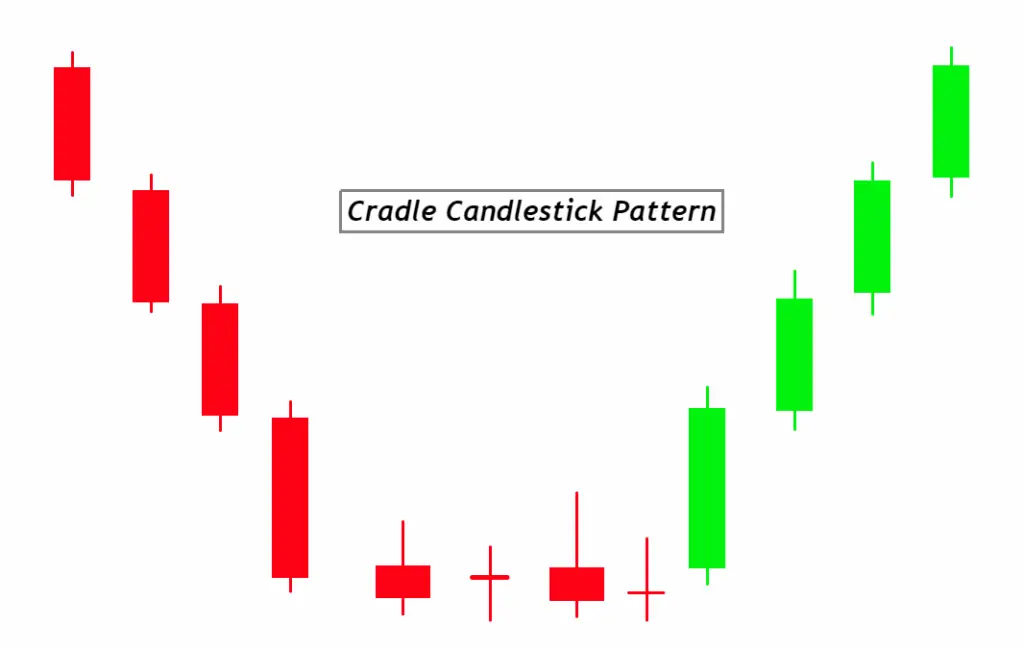
22. Cradle Candlestick Pattern
- Definition: The Cradle Candlestick Pattern is a bullish reversal pattern that forms in a downtrend. It consists of a series of declining small-bodied candles followed by a large bullish candle, signifying a turnaround in sentiment.
- Signal: Indicates a potential bullish reversal.
- Trend: Often marks the beginning of a bullish phase after a downtrend.
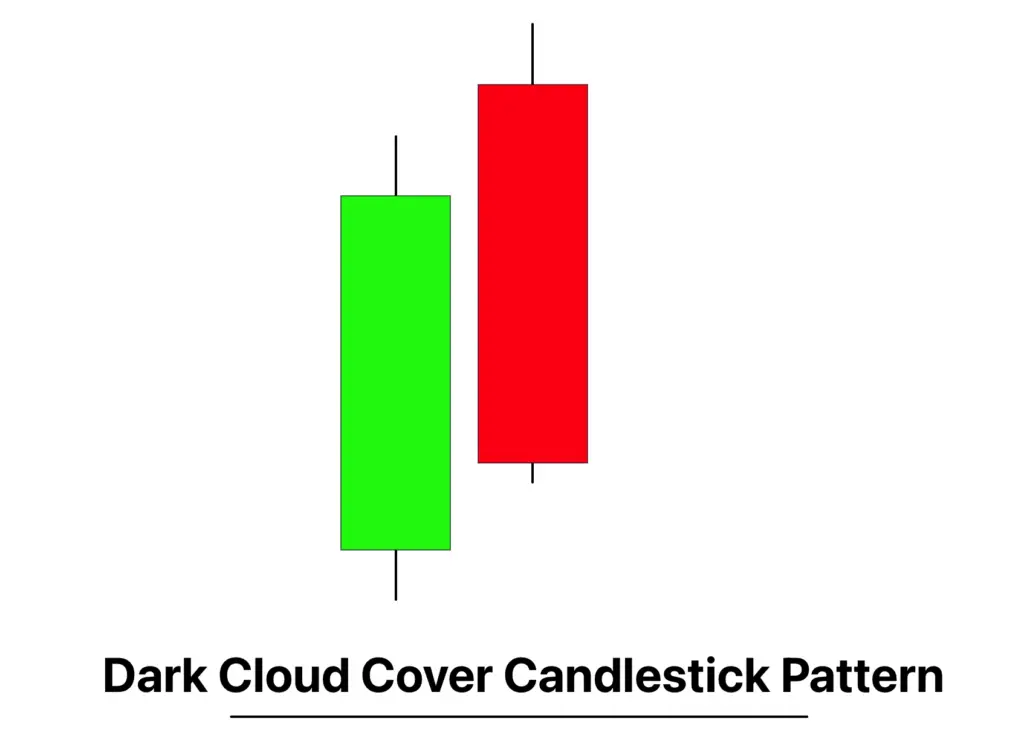
23. Dark Cloud Cover Candlestick Pattern
- Definition: The Dark Cloud Cover Candlestick Pattern is a bearish reversal pattern formed by a long bullish candle followed by a long bearish candle. The bearish candle opens above the previous high but closes well into the body of the first candle.
- Signal: Indicates a potential bearish reversal after an uptrend.
- Trend: Suggests weakening of the current bullish trend.
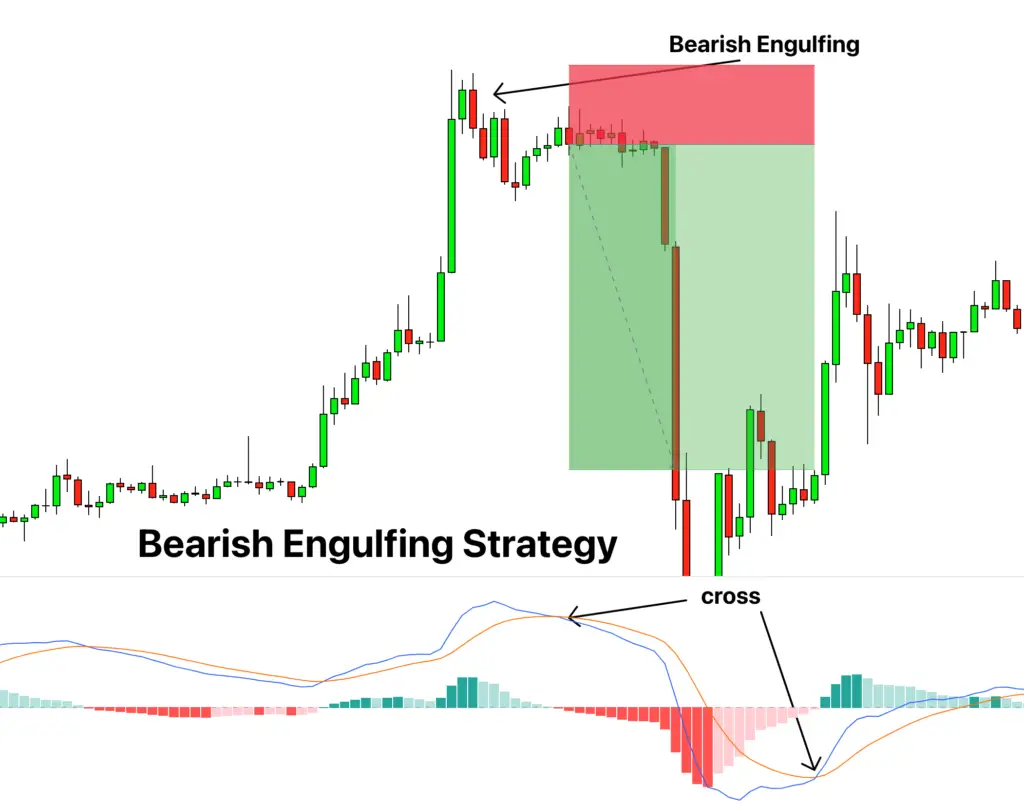
24. Bearish Engulfing Candlestick Pattern
- Definition: The Bearish Engulfing Candlestick Pattern occurs when a small bullish candle is completely engulfed by a following large bearish candle. It indicates that bears have overtaken the bulls.
- Signal: Signals a bearish reversal.
- Trend: Often marks the start of a bearish trend.
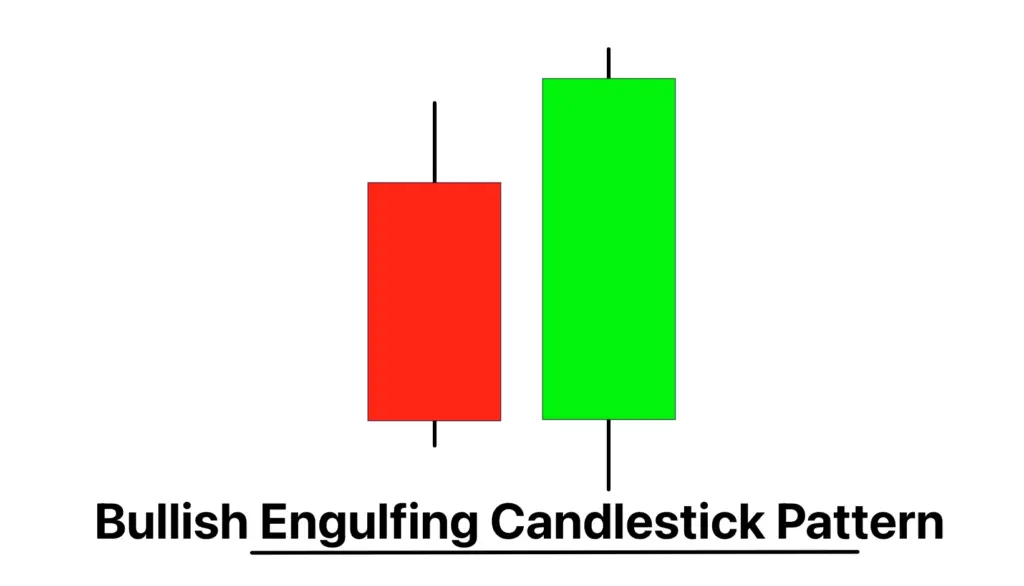
25. Bullish Engulfing Candlestick Pattern
- Definition: The Bullish Engulfing Candlestick Pattern is a reversal pattern that features a small bearish candle completely engulfed by a larger bullish candle, suggesting a shift in control from sellers to buyers.
- Signal: Indicates a bullish reversal.
- Trend: Typically appears at the bottom of a downtrend.
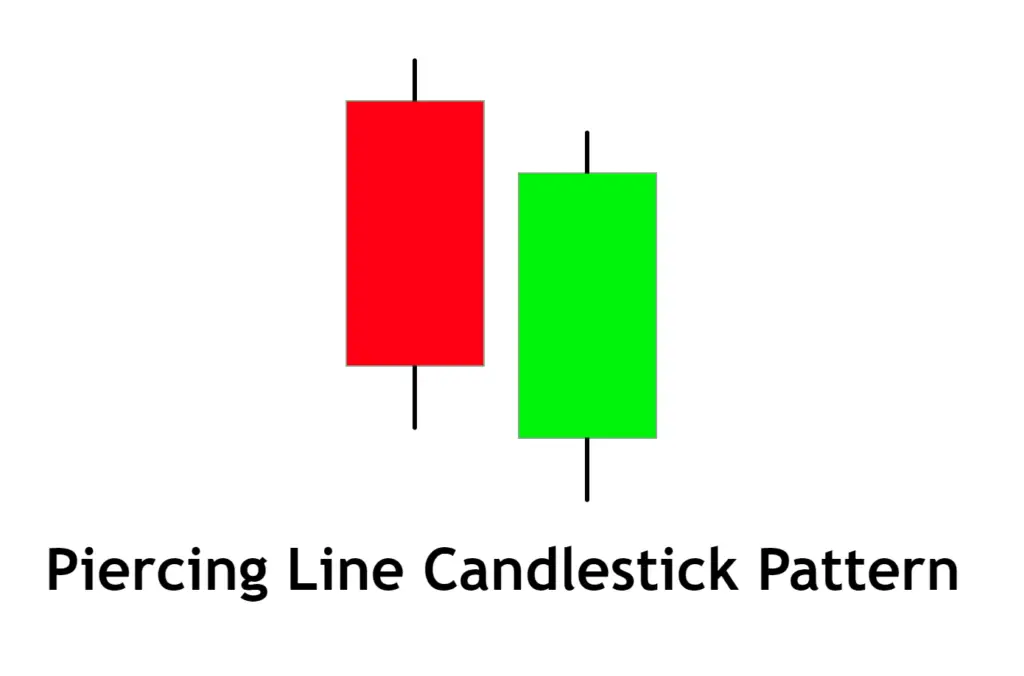
26. Piercing Line Candlestick Pattern
- Definition: The Piercing Line Candlestick Pattern is a bullish reversal pattern consisting of a long bearish candle followed by a long bullish candle. The second candle opens lower than the first candle’s low but closes more than halfway into the first candle’s body.
- Signal: Signals a potential reversal of the current downtrend.
- Trend: Often indicates the beginning of a bullish trend.
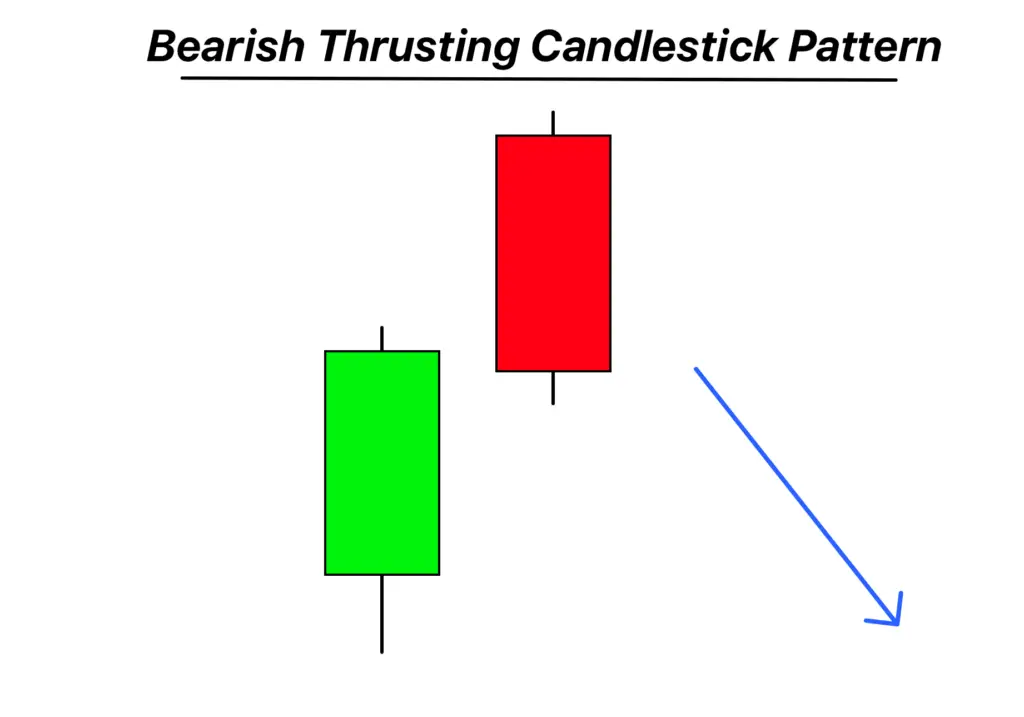
27. Thrusting Candlestick Pattern
- Definition: The Thrusting Candlestick Pattern is a bearish continuation pattern that occurs in a downtrend. It’s formed by a long bearish candle followed by a bullish candle that opens within the body of the previous candle and closes just above the midpoint but not above the high.
- Signal: Indicates continuation of the current bearish trend.
- Trend: Suggests further downward movement.
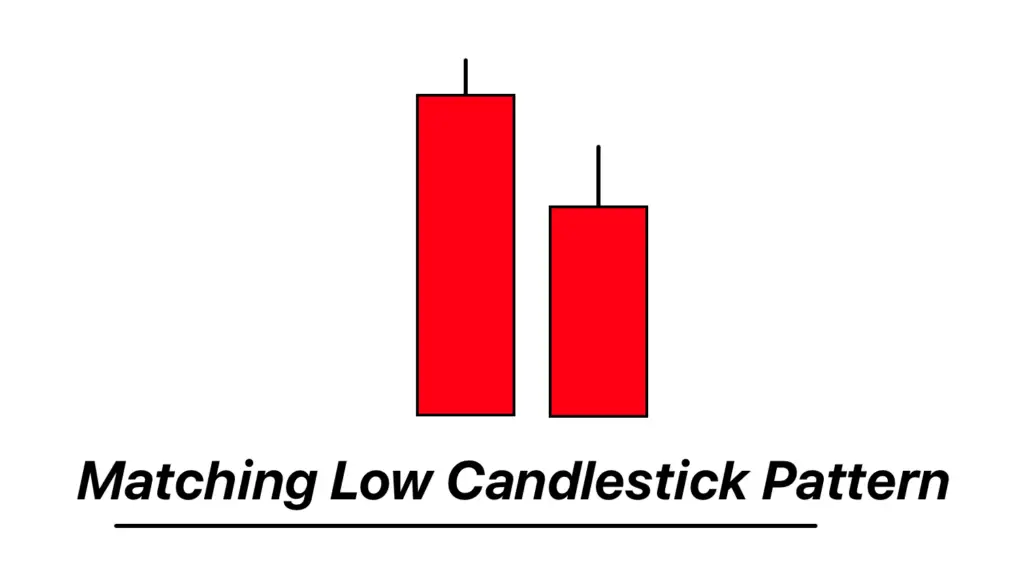
28. Matching Low Candlestick Pattern
- Definition: The Matching Low Candlestick Pattern is a bullish reversal pattern seen in downtrends. It consists of two consecutive bearish candles with the same closing price, showing that the selling pressure is starting to wane.
- Signal: Indicates a potential bullish reversal.
- Trend: Suggests a bottom forming in a downtrend.
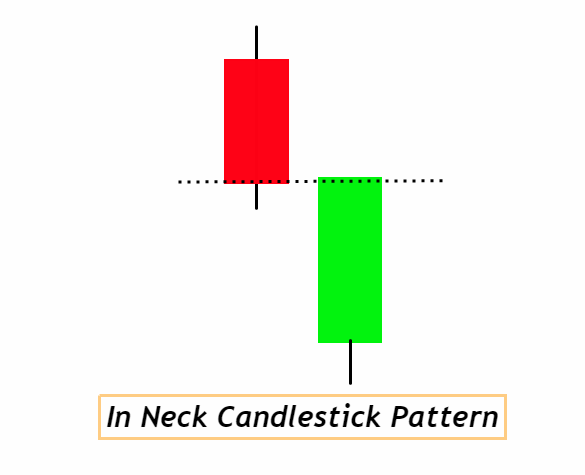
29. In-neck Candlestick Pattern
- Definition: The In-neck Candlestick Pattern is a bearish continuation pattern occurring in a downtrend. It consists of a long bearish candle followed by a smaller bullish candle that closes near the low of the previous candle.
- Signal: Indicates the continuation of the current downtrend.
- Trend: Suggests that the bearish trend will persist.
30. On-neck Candlestick Pattern
- Definition: The On-neck Candlestick Pattern, similar to the In-neck pattern, is a bearish continuation pattern. It forms with a long bearish candle followed by a small bullish candle that closes near the low of the first candle.
- Signal: Signals ongoing bearish sentiment.
- Trend: Indicates that the downtrend is likely to continue.

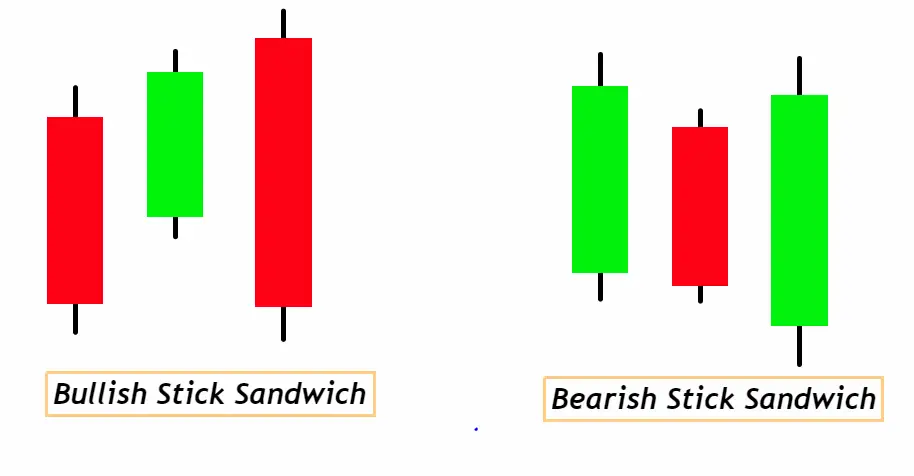
31. Stick Sandwich Candlestick Pattern
- Definition: The Stick Sandwich Candlestick Pattern is a bullish reversal pattern consisting of two black (bearish) candles surrounding one white (bullish) candle. The closing prices of the bearish candles are at about the same level, forming a ‘sandwich’.
- Signal: Suggests a bullish reversal.
- Trend: Often indicates a bottoming out in a bearish trend.
32. Above The Stomach Candlestick Pattern
- Definition: The Above The Stomach Candlestick Pattern is a bullish continuation pattern. It’s formed by a bearish candle followed by a bullish candle that opens above the midpoint of the body of the first candle.
- Signal: Indicates continued bullish sentiment.
- Trend: Suggests the uptrend is likely to persist.

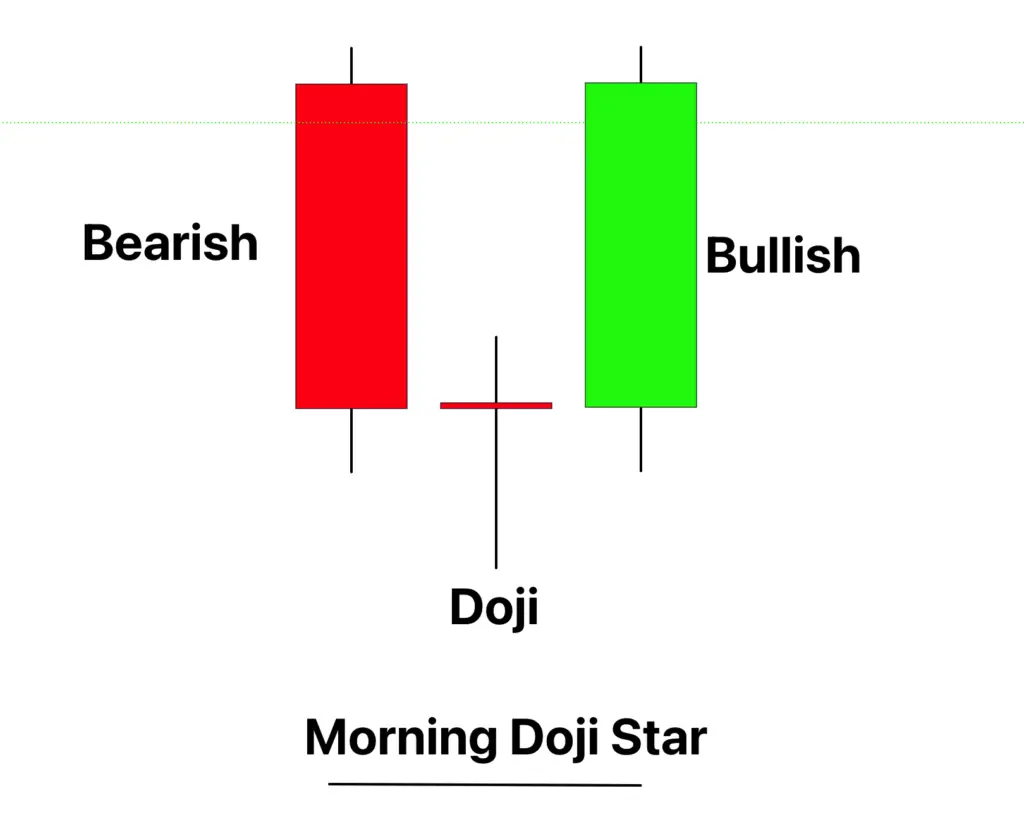
33. Bullish Morning Doji Star Candlestick Pattern
- Definition: The Bullish Morning Doji Star Candlestick Pattern is a three-candle bullish reversal pattern. It starts with a long bearish candle, followed by a Doji that gaps below the previous candle, and concludes with a long bullish candle.
- Signal: Indicates a strong reversal from bearish to bullish.
- Trend: Often seen at the bottom of a downtrend.
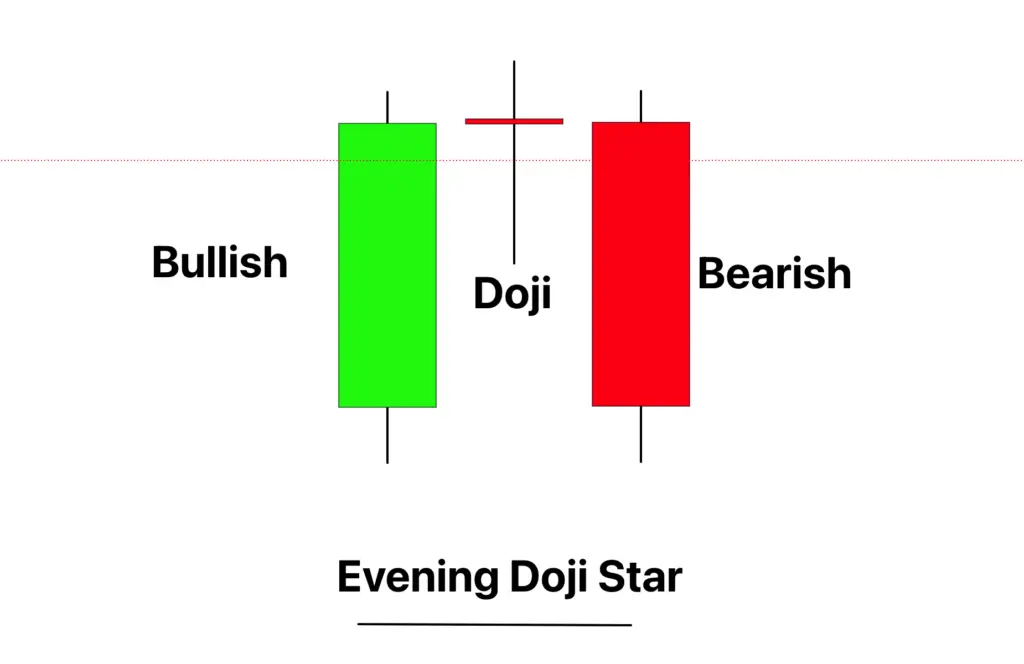
34. Bearish Evening Doji Star Candlestick Pattern
- Definition: The Bearish Evening Doji Star Candlestick Pattern is a three-candle bearish reversal pattern. It begins with a long bullish candle, followed by a Doji that gaps above the previous candle, and ends with a long bearish candle.
- Signal: Signals a potential bearish reversal after an uptrend.
- Trend: Usually occurs at the top of an uptrend.
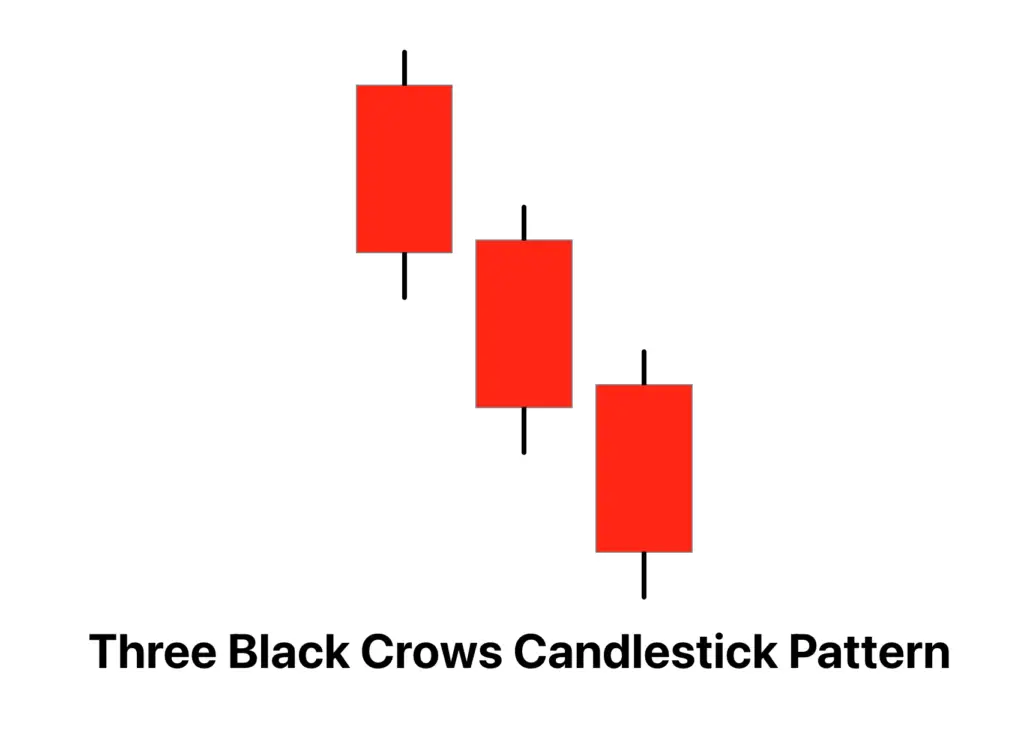
35. Three Black Crows Candlestick Pattern
- Definition: The Three Black Crows Candlestick Pattern consists of three long, consecutive bearish candles with little or no lower shadows, each opening within the previous candle’s body and closing at a new low.
- Signal: Indicates a strong bearish turn.
- Trend: Seen as a strong signal of a bearish reversal.
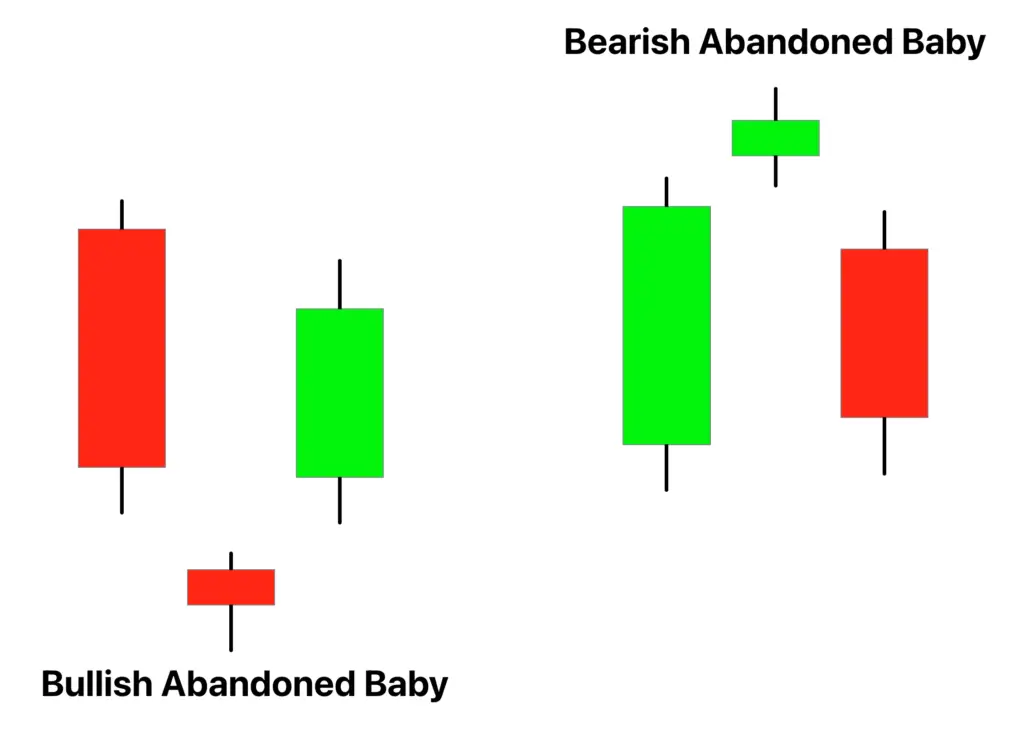
36. Abandoned Baby Candlestick Pattern
- Definition: The Abandoned Baby Candlestick Pattern is a three-candle reversal pattern. It consists of a long candle, followed by a Doji that gaps away from the first candle, and then a candle of the opposite type that also gaps away from the Doji.
- Signal: Signals a potential reversal, either bullish or bearish.
- Trend: Can appear at both tops and bottoms of trends.
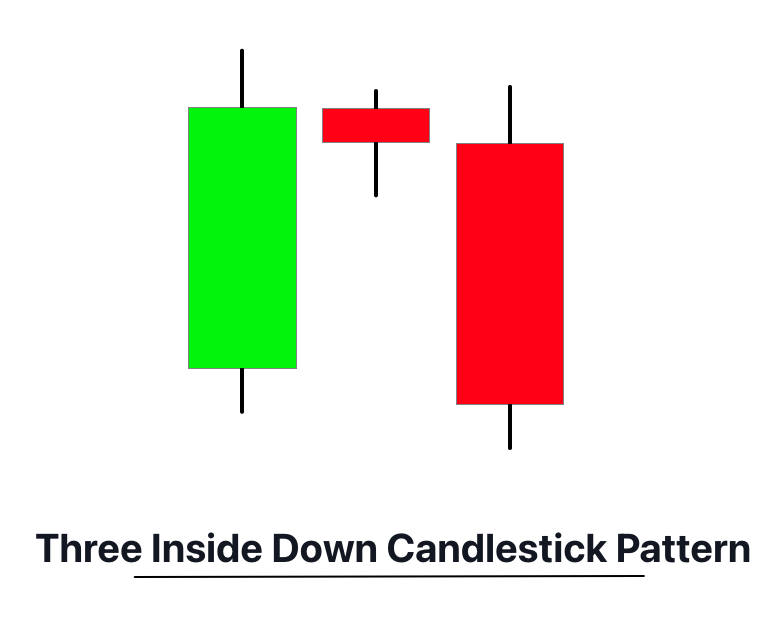
37. Three Inside Down Candlestick Pattern
- Definition: The Three Inside Down Candlestick Pattern is a bearish reversal pattern that starts with a large bullish candle, followed by a bearish candle that fits within its body, and then another bearish candle that closes below the second candle’s close.
- Signal: Indicates a bearish reversal.
- Trend: Typically found at the end of an uptrend.
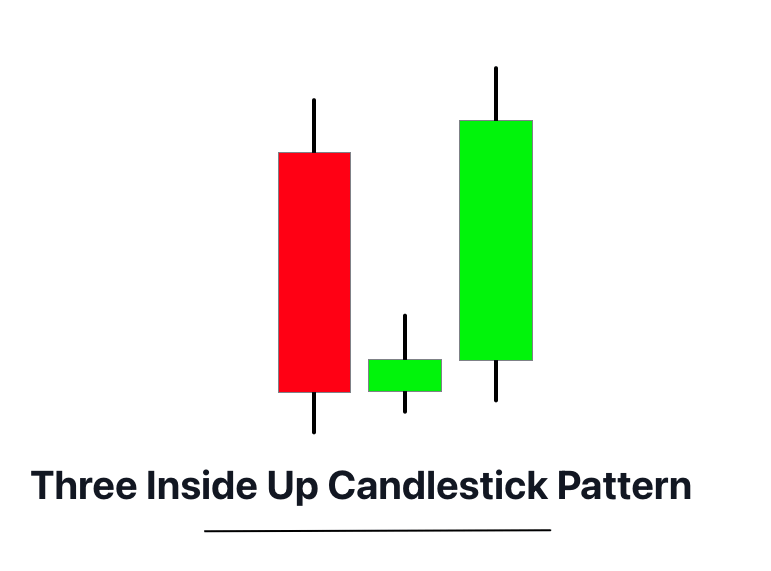
38. Three Inside Up Candlestick Pattern
- Definition: The Three Inside Up Candlestick Pattern is a bullish reversal pattern beginning with a large bearish candle, followed by a bullish candle that fits within its body, and a third bullish candle that closes above the second candle’s close.
- Signal: Suggests a bullish reversal.
- Trend: Usually appears at the bottom of a downtrend.
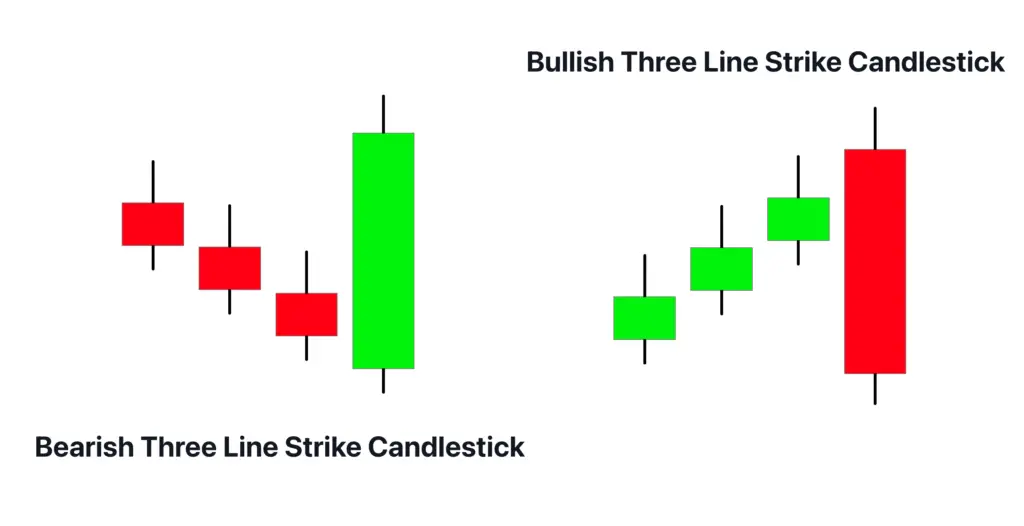
39. Three-Line Strike Candlestick Pattern
- Definition: The Three-Line Strike Candlestick Pattern consists of three candles of the same type, followed by a fourth candle of the opposite type that ‘strikes’ back and closes beyond the opening of the first candle.
- Signal: Indicates a strong reversal in the direction of the fourth candle.
- Trend: Can be bullish or bearish, depending on the direction of the fourth candle.
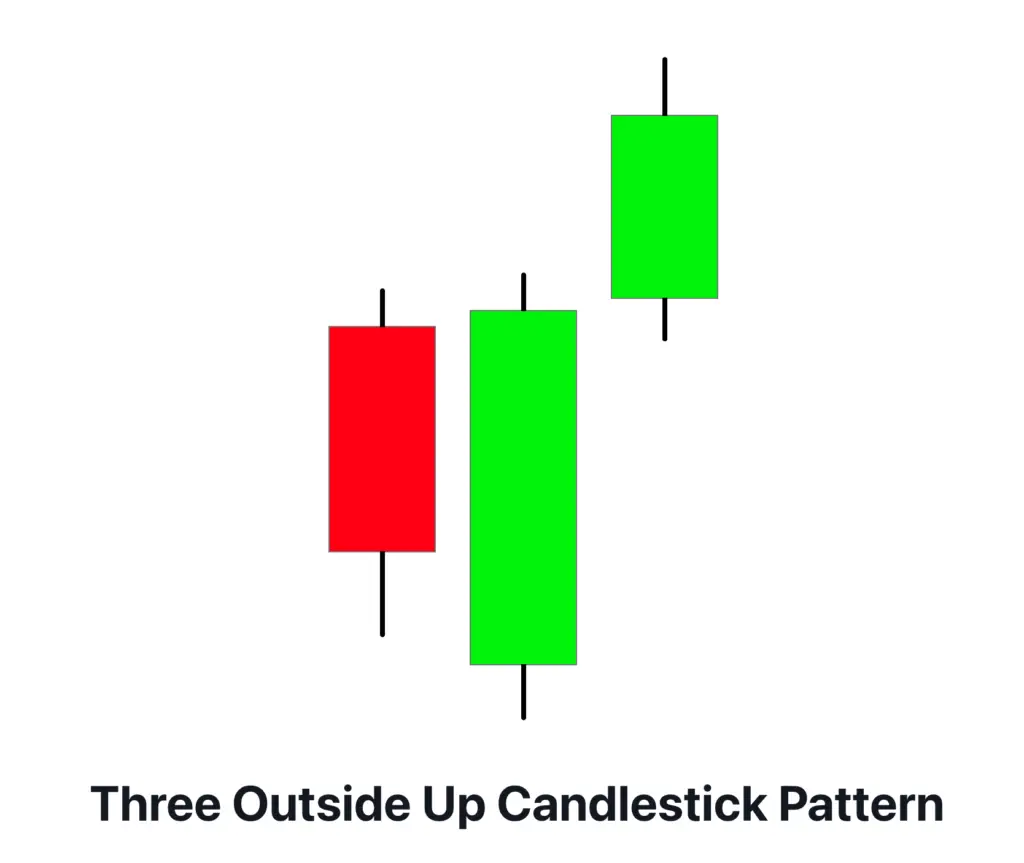
40. Three Outside Up Candlestick Pattern
- Definition: The Three Outside Up Candlestick Pattern is a bullish reversal pattern starting with a bearish candle, followed by a larger bullish candle that engulfs it, and a third bullish candle that closes higher.
- Signal: Suggests a shift from bearish to bullish sentiment.
- Trend: Often appears during a downtrend and signals a reversal.
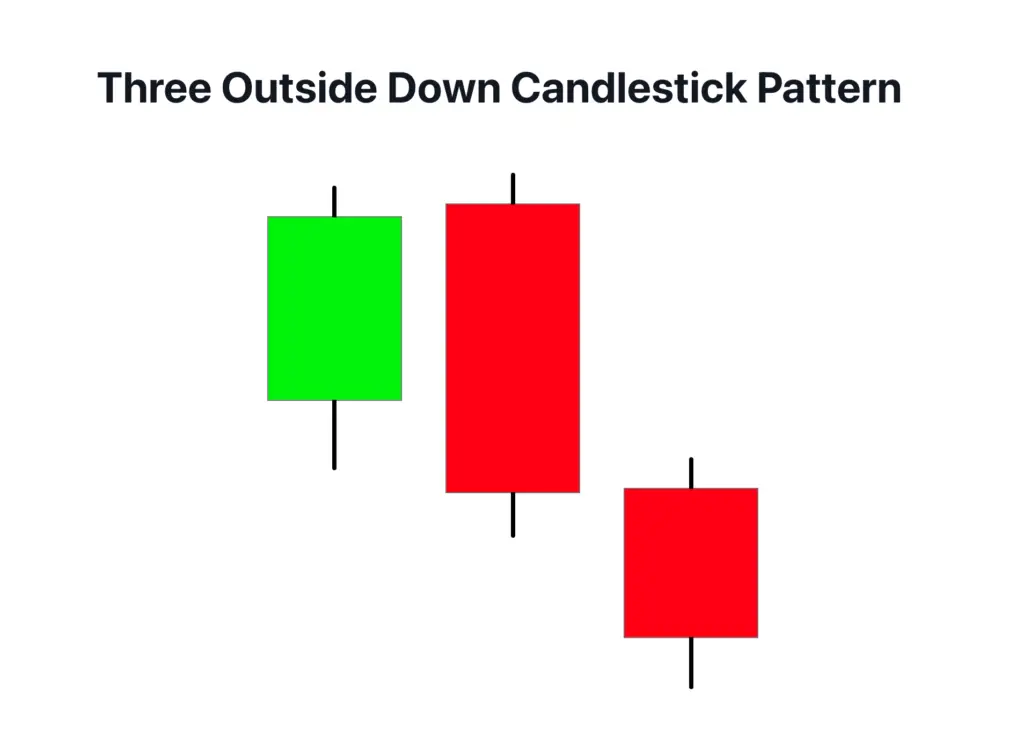
41. Three Outside Down Candlestick Pattern
- Definition: The Three Outside Down Candlestick Pattern is a bearish reversal pattern beginning with a bullish candle, followed by a larger bearish candle that engulfs it, and a third bearish candle that closes lower.
- Signal: Indicates a shift from bullish to bearish sentiment.
- Trend: Typically occurs during an uptrend and signals a reversal.
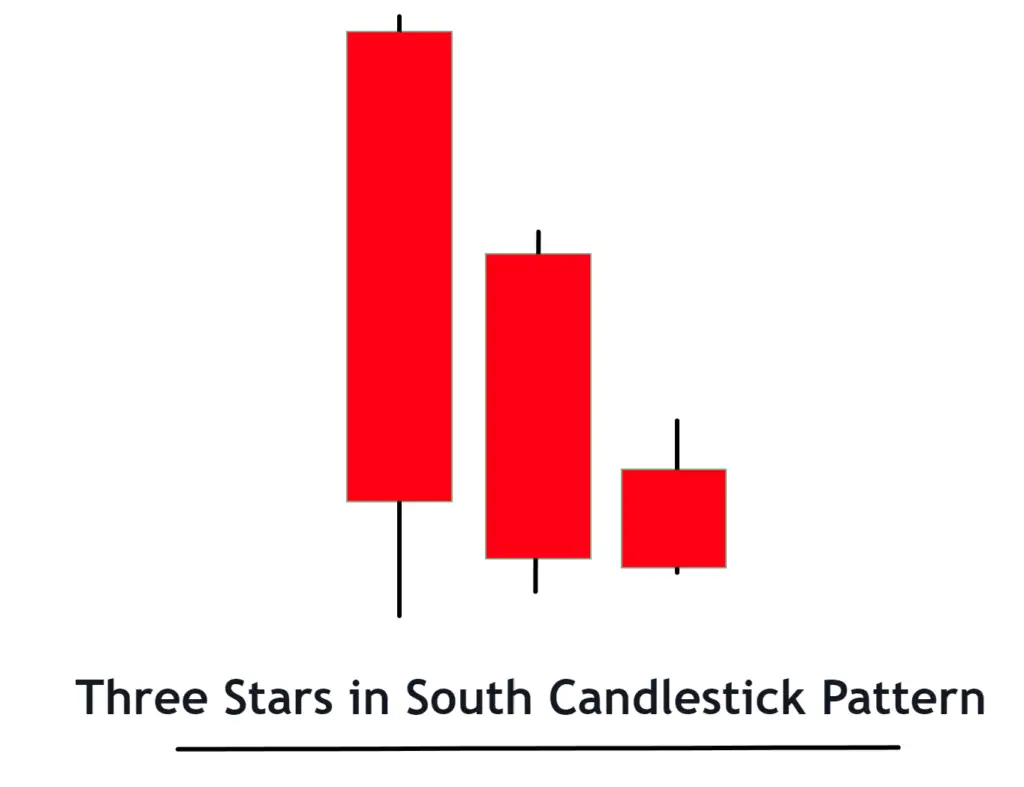
42. Three Stars in the South Candlestick Pattern
- Definition: The Three Stars in the South Candlestick Pattern is a bullish reversal pattern consisting of three small-bodied candles, each with lower tails, appearing during a downtrend.
- Signal: Suggests a gradual loss of bearish momentum and a potential bullish reversal.
- Trend: Usually found at the end of a downtrend.
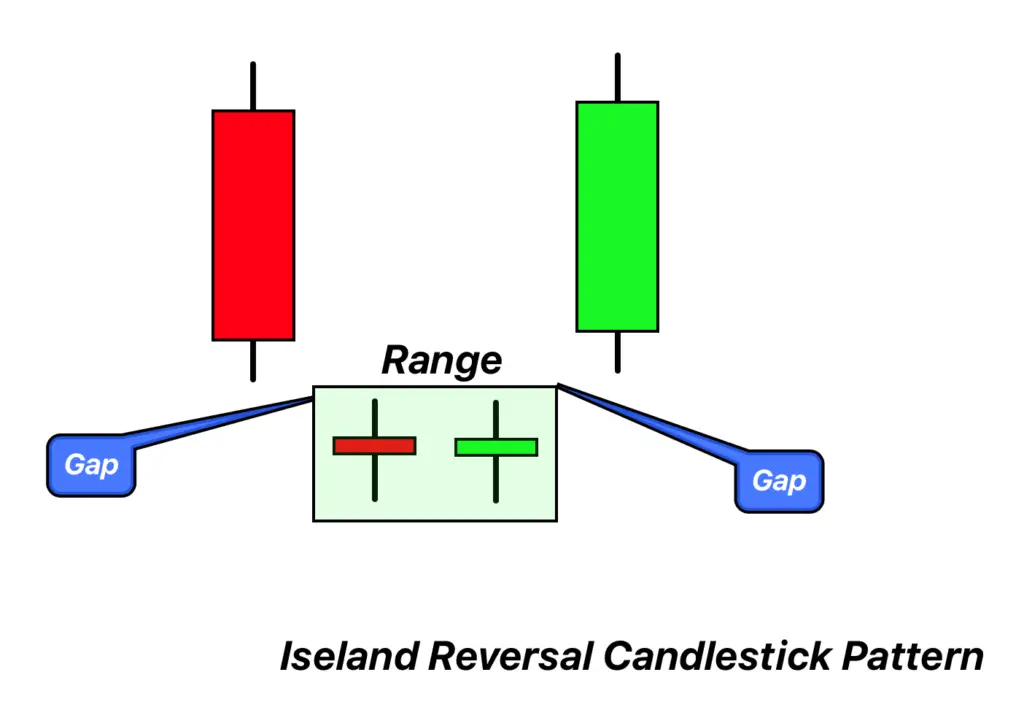
43. Island Reversal Candlestick Pattern
- Definition: The Island Reversal Candlestick Pattern is a reversal pattern characterized by a gap followed by a consolidation (forming an ‘island’), and then another gap in the opposite direction.
- Signal: Indicates a significant reversal in the market.
- Trend: Can be either bullish or bearish, depending on the direction of the gaps.
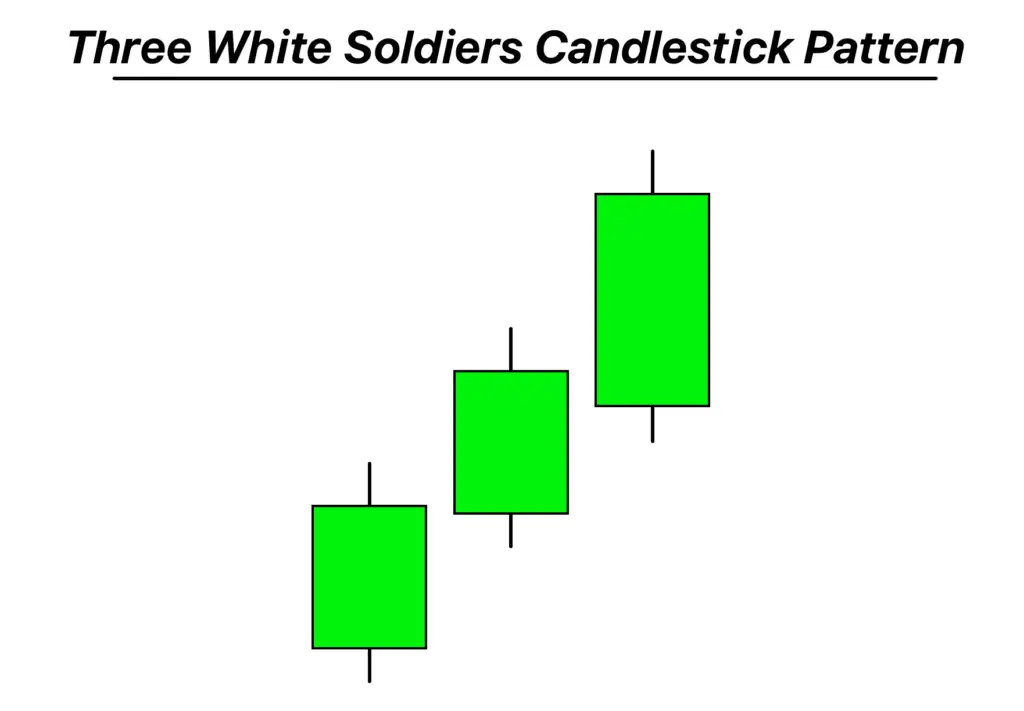
44. Three White Soldiers Candlestick Pattern
- Definition: The Three White Soldiers Candlestick Pattern consists of three consecutive long bullish candles, each opening and closing higher than the previous one, typically occurring after a downtrend.
- Signal: Indicates a strong bullish reversal.
- Trend: Often signals the start of a new bullish trend.
45. Stalled Candlestick Pattern
- Definition: The Stalled Candlestick Pattern is a bearish reversal pattern appearing in an uptrend. It consists of three bullish candles, with the last candle opening near the previous close and having a small body, indicating a loss of momentum.
- Signal: Suggests that the uptrend is losing strength.
- Trend: Typically indicates a potential reversal of the current uptrend.

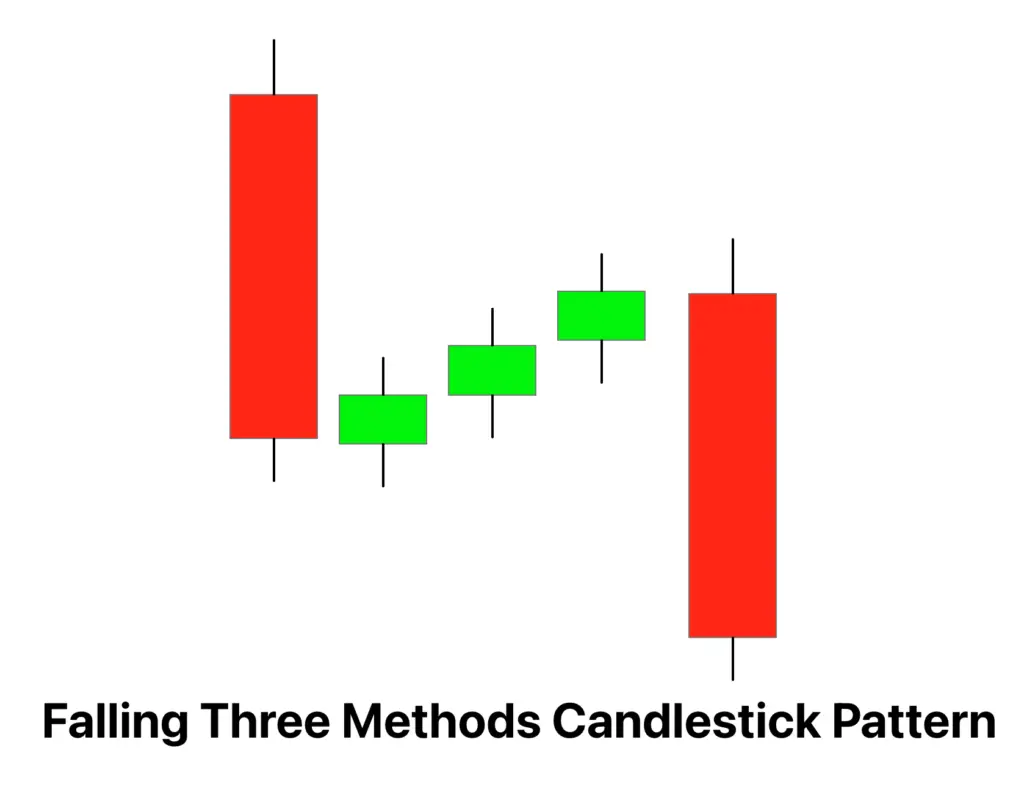
46. Falling Three Methods Candlestick Pattern
- Definition: The Falling Three Methods Candlestick Pattern is a bearish continuation pattern consisting of five candles: a long bearish candle, followed by three small-bodied bullish candles contained within the range of the first candle, and ending with another long bearish candle.
- Signal: Indicates the continuation of the current downtrend.
- Trend: Appears within a downtrend, suggesting ongoing bearish momentum.
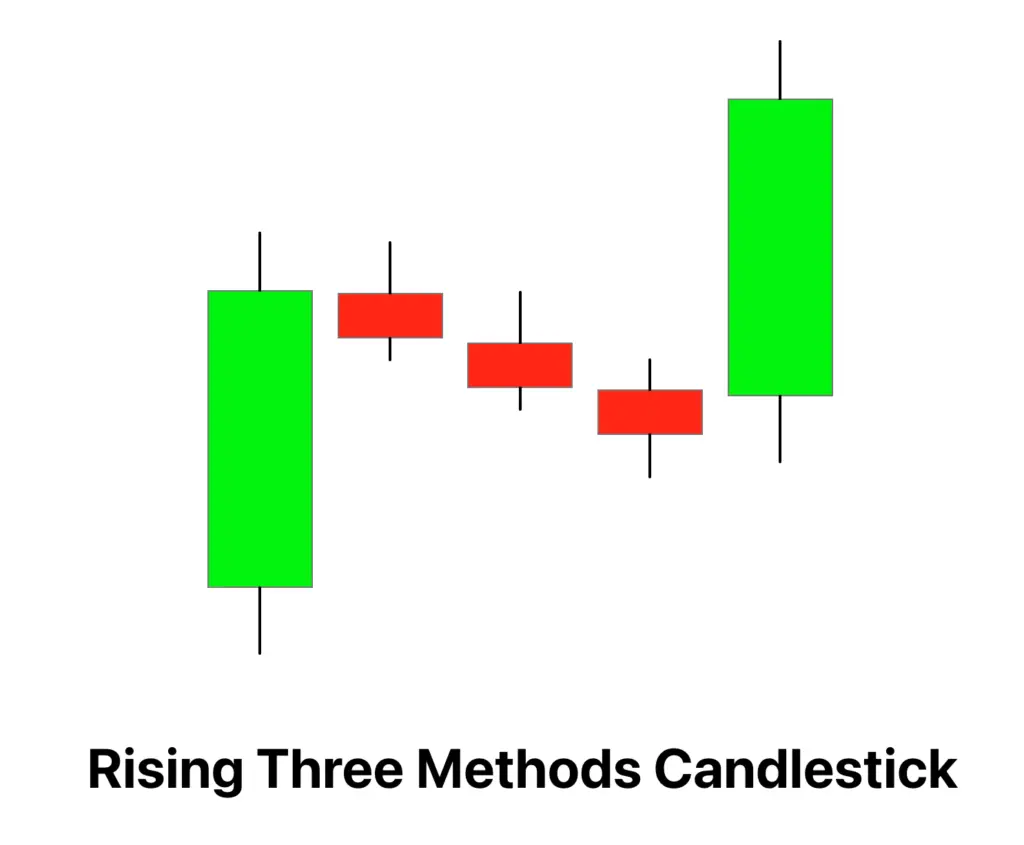
47. Rising Three Methods Candlestick Pattern
- Definition: The Rising Three Methods Candlestick Pattern is a bullish continuation pattern composed of five candles: a long bullish candle, followed by three small-bodied bearish candles within the range of the first candle, and concluding with another long bullish candle.
- Signal: Suggests continuation of the current uptrend.
- Trend: Typically found within an uptrend, indicating sustained bullish movement.
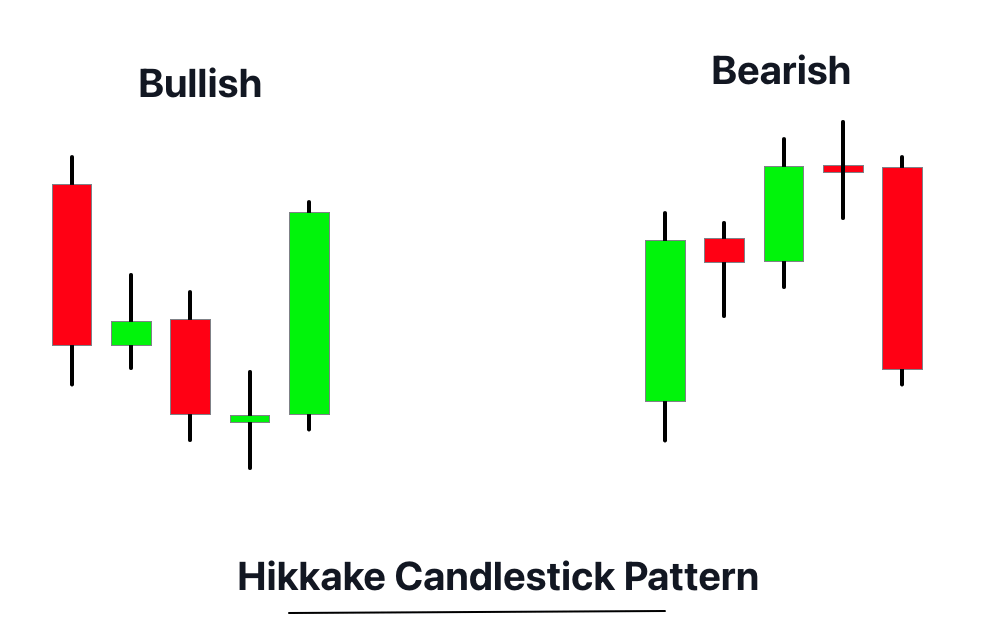
48. Hikkake Candlestick Pattern
- Definition: The Hikkake Candlestick Pattern is a pattern of indecision and potential breakout. It starts with a bar that has a higher high and lower low than the previous one (an inside bar), followed by several bars that move in one direction before a sudden reversal.
- Signal: Indicates a potential breakout or reversal in the direction opposite to the initial move.
- Trend: Can appear in both uptrends and downtrends.
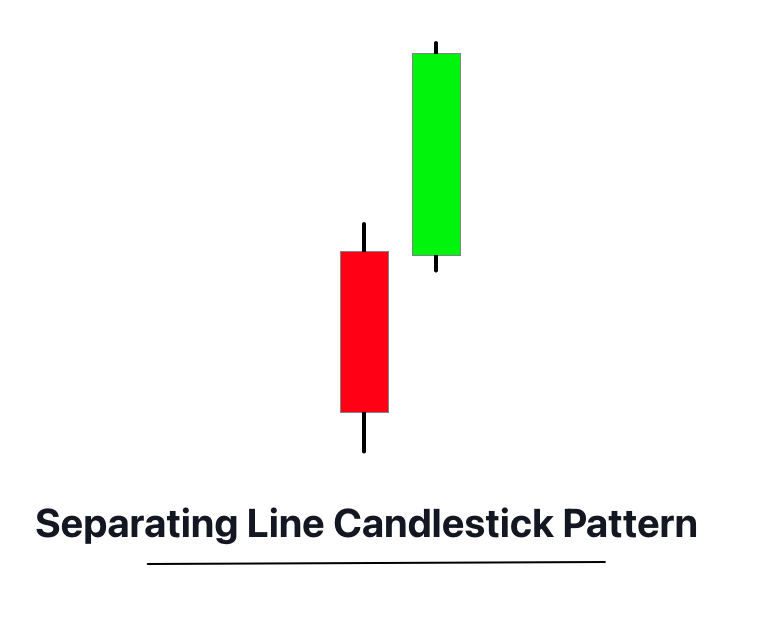
49. Separating Lines Candlestick Pattern
- Definition: The Separating Lines Candlestick Pattern consists of two candles of opposite colors. In a bullish version, a long bearish candle is followed by a long bullish candle that opens at the same price as the previous open. In the bearish version, it’s reversed.
- Signal: Indicates a potential reversal, bullish or bearish based on the pattern.
- Trend: Can signify a change in the current trend.
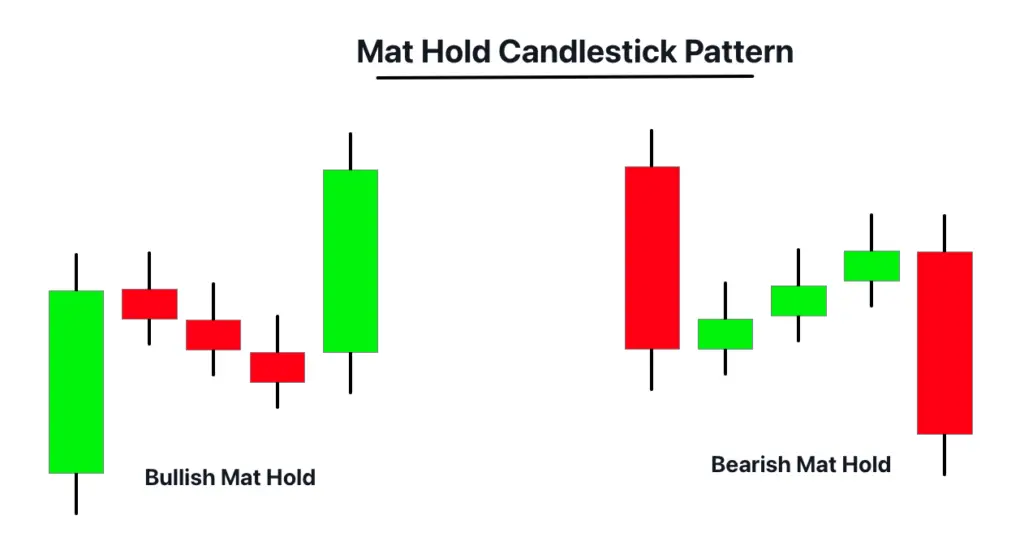
50. Mat Hold Candlestick Pattern
- Definition: The Mat Hold Candlestick Pattern is a bullish continuation pattern appearing in an uptrend. It begins with a strong bullish candle, followed by a series of smaller bearish candles that stay within the range of the first candle, and concludes with another strong bullish candle.
- Signal: Suggests the continuation of the bullish trend.
- Trend: Indicates ongoing bullish momentum.
51. The Modified Hikkake Candlestick Pattern
- Definition: The Modified Hikkake Candlestick Pattern is a variation of the Hikkake that includes additional confirmation. It begins with an inside bar, followed by a false breakout and then a reversal, confirmed by subsequent price action.
- Signal: Indicates a potential reversal or breakout.
- Trend: Useful in both bullish and bearish market conditions.

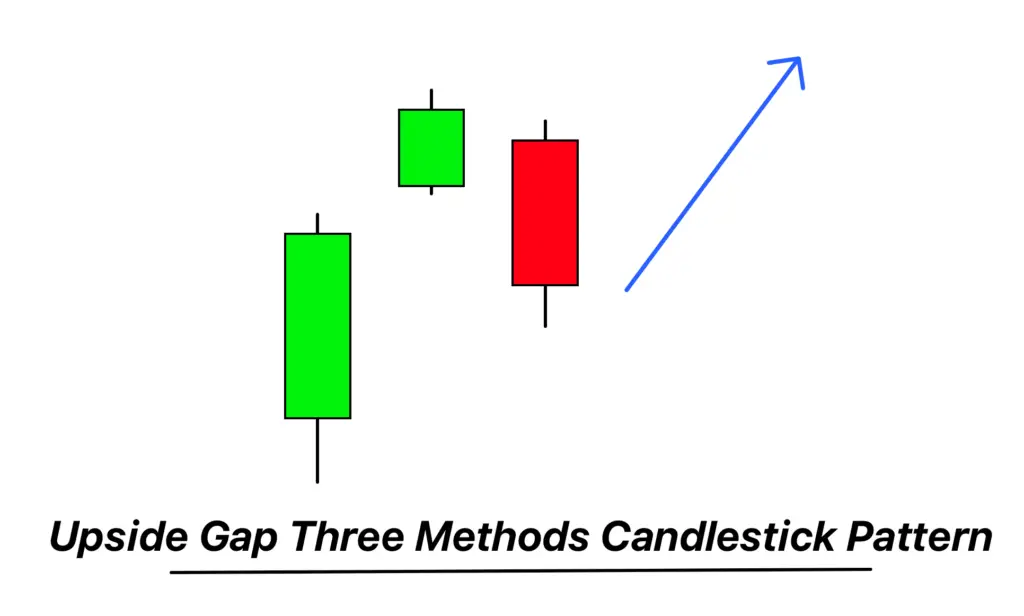
52. Upside Gap Three Methods Candlestick Pattern
- Definition: The Upside Gap Three Methods Candlestick Pattern is a bullish continuation pattern. It starts with a long bullish candle, followed by a small bearish candle that gaps up, and a third candle that is a long bullish candle closing above the first candle’s close.
- Signal: Indicates the continuation of the bullish trend.
- Trend: Appears during an uptrend.
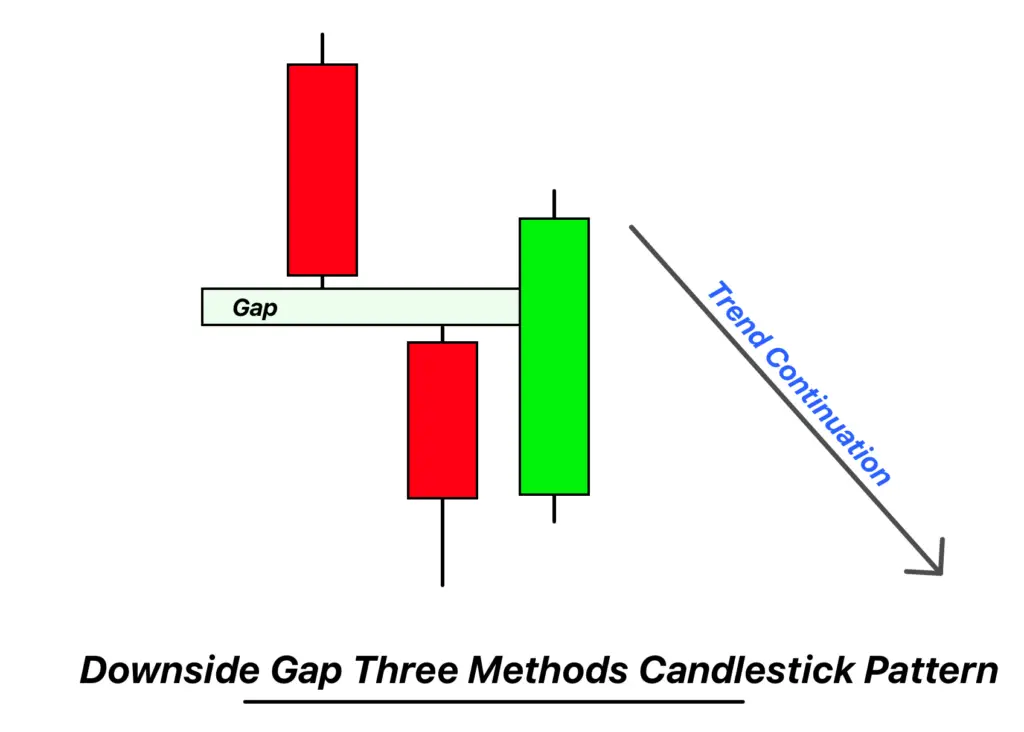
53. Downside Gap Three Methods Candlestick Pattern
- Definition: The Downside Gap Three Methods Candlestick Pattern is a bearish continuation pattern consisting of a long bearish candle, followed by a small bullish candle that gaps down, and a third long bearish candle that closes below the first candle’s close.
- Signal: Suggests continuation of the bearish trend.
- Trend: Typically occurs during a downtrend.
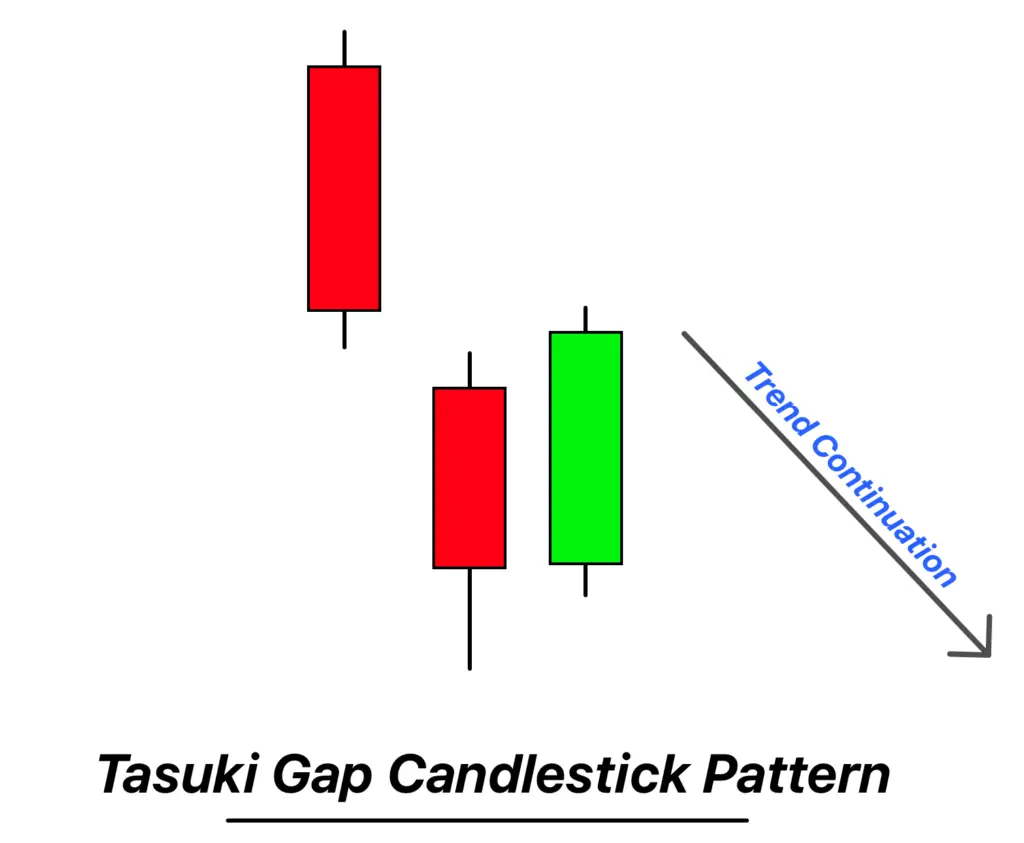
54. Tasuki Gap Candlestick Pattern
- Definition: The Tasuki Gap Candlestick Pattern is a continuation pattern that can be bullish or bearish. In the bullish version, a gap up is followed by a bearish candle that doesn’t close the gap. The bearish version is the opposite.
- Signal: Indicates a continuation of the current trend.
- Trend: Appears during a clear uptrend or downtrend.
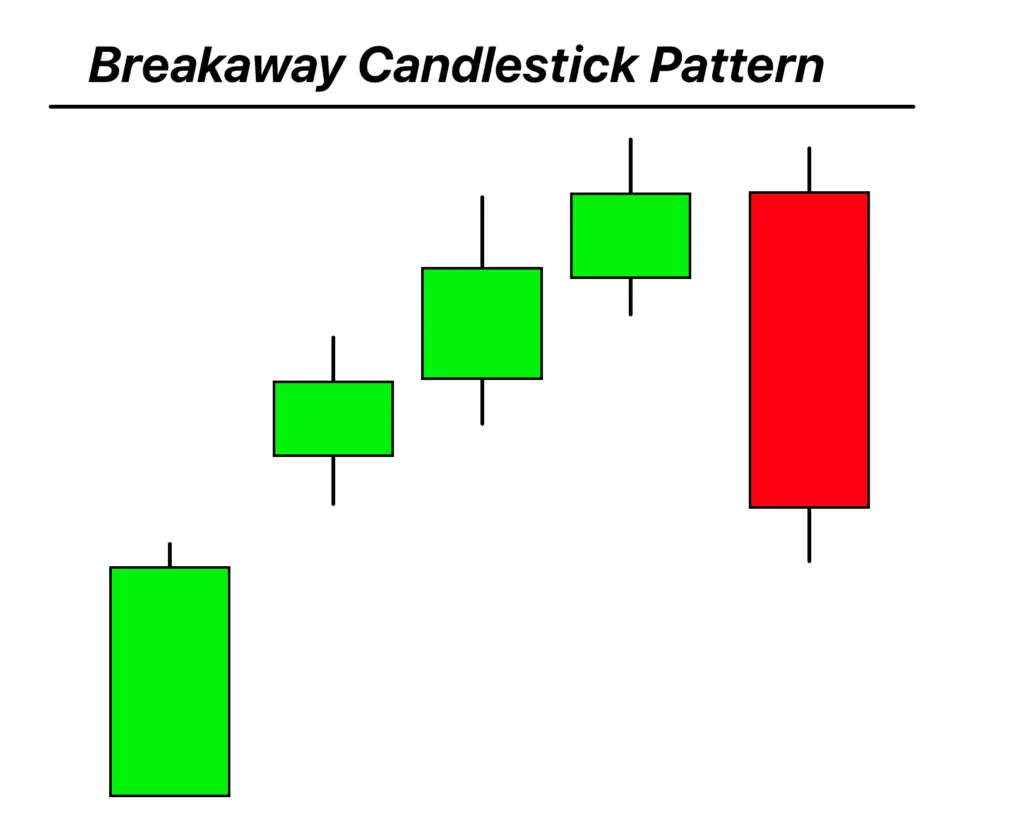
55. Breakaway Candlestick Pattern
- Definition: The Breakaway Candlestick Pattern is a reversal pattern marked by a gap followed by candles that move in the opposite direction of the prevailing trend, suggesting a potential change in trend.
- Signal: Signals a potential trend reversal.
- Trend: Can be seen at the end of both uptrends and downtrends.
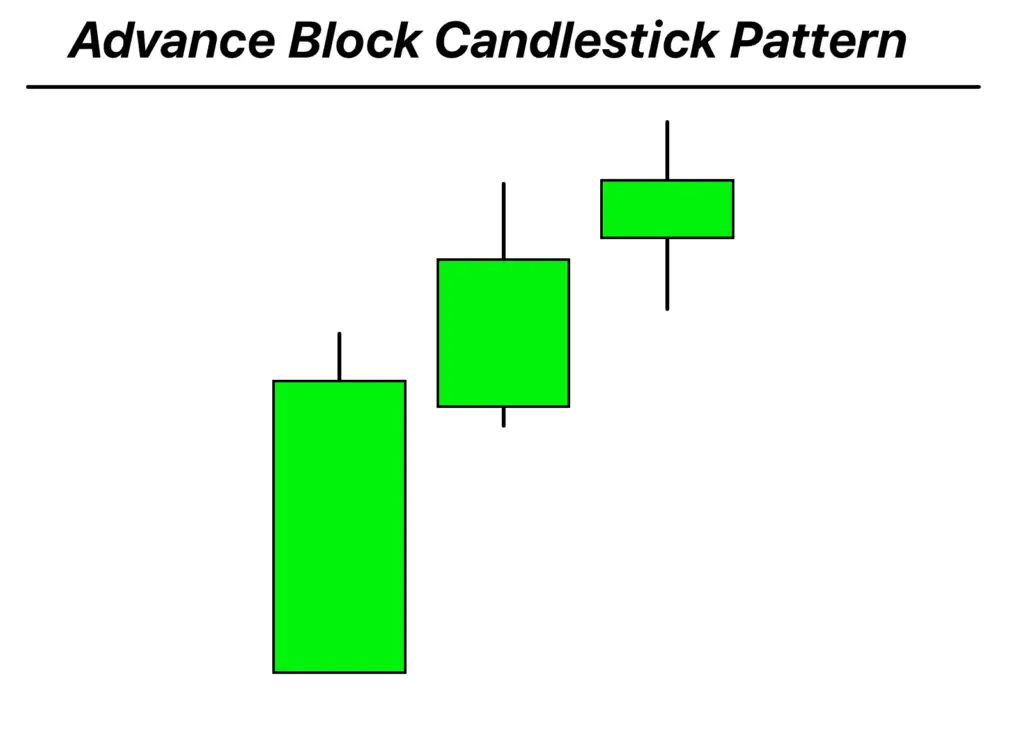
56. Advance Block Candlestick Pattern
- Definition: The Advance Block Candlestick Pattern is a bearish reversal pattern appearing in uptrends. It consists of three bullish candles with each subsequent candle showing a smaller body and longer upper shadows, indicating weakening bullish momentum.
- Signal: Suggests a possible bearish reversal.
- Trend: Typically found at the peak of an uptrend.
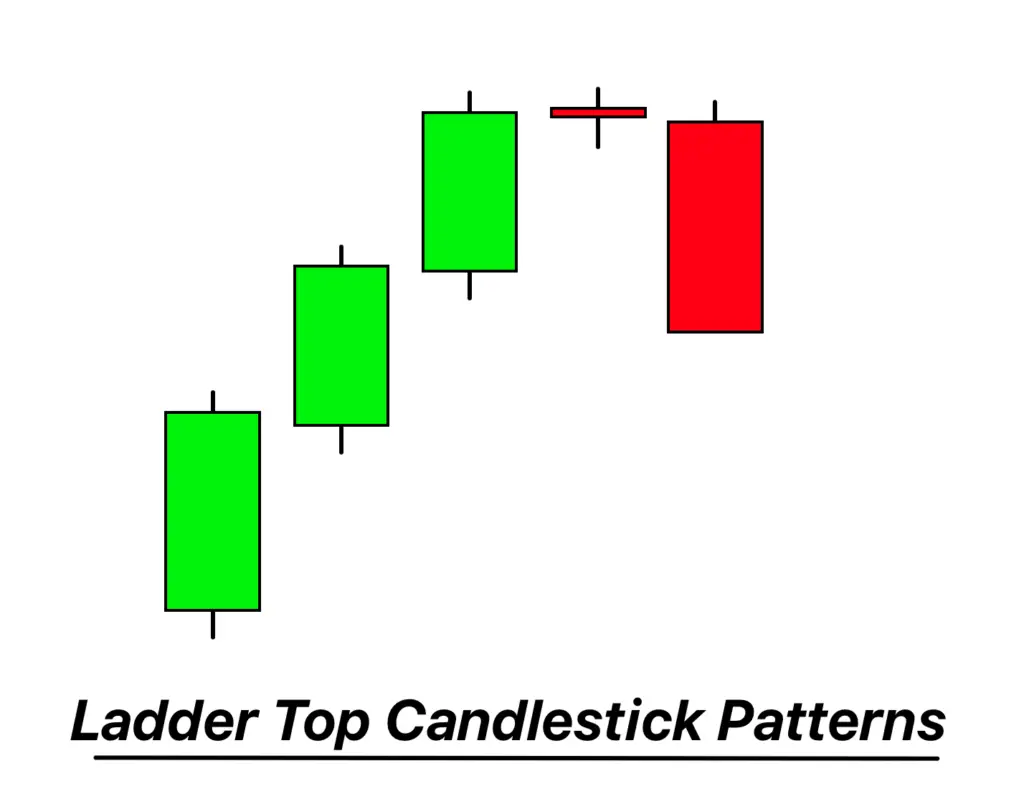
57. Ladder Top Candlestick Pattern
- Definition: The Ladder Top Candlestick Pattern is a bearish reversal pattern that appears in an uptrend. It is formed by a sequence of candles with higher highs but closing near their lows, resembling a ladder.
- Signal: Indicates a potential bearish reversal.
- Trend: Often seen at the top of an uptrend.
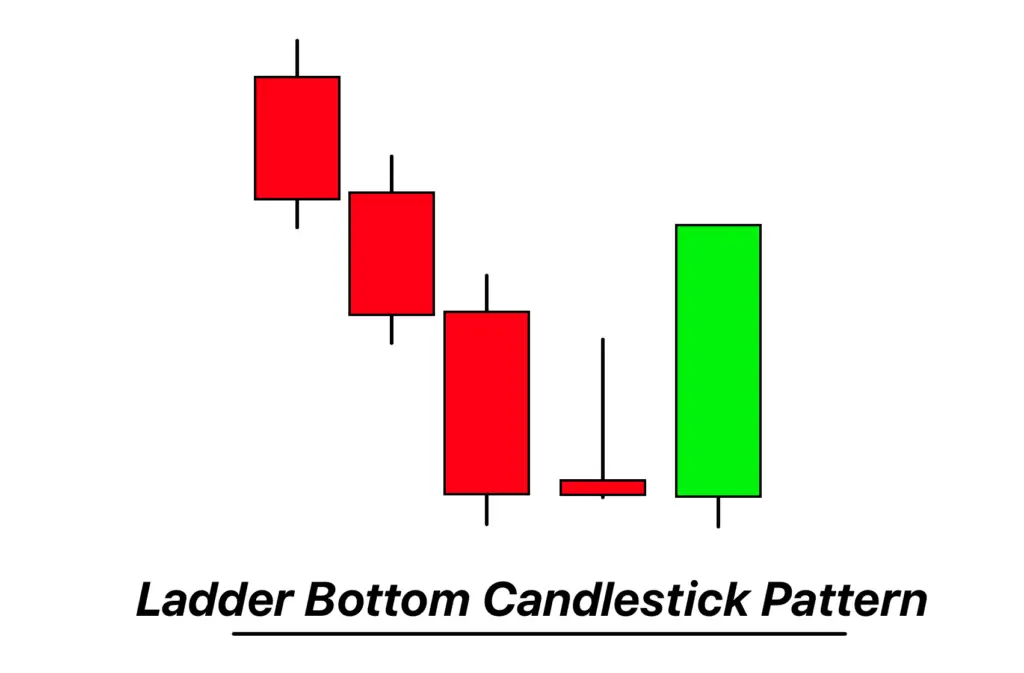
58. Ladder Bottom Candlestick Pattern
- Definition: The Ladder Bottom Candlestick Pattern is a bullish reversal pattern occurring in a downtrend. It consists of a series of candles making lower lows but closing near their highs, forming a ladder-like appearance.
- Signal: Suggests a potential bullish reversal.
- Trend: Typically occurs at the bottom of a downtrend.
Common mistakes to avoid
| Common Mistakes | Explanation | Impact on Trading | How to Avoid |
|---|---|---|---|
| Overtrading on Patterns Alone | Relying exclusively on candlestick patterns without considering other analysis tools. | Can lead to misinterpreting market signals and making uninformed decisions. | Combine candlestick patterns with other technical analysis tools and indicators. |
| Ignoring the Trend | Using candlestick patterns to trade against the prevailing market trend. | Increases the risk of trades as candlestick patterns are more reliable when following the trend. | Always consider the overall market trend and use candlestick patterns that align with it. |
| Lack of Confirmation | Entering trades based on unconfirmed candlestick patterns. | Premature decisions can result in false signals and losses. | Wait for the pattern to complete and look for additional confirmation signals before trading. |
| Ignoring Market News | Overlooking economic events and news that can affect market sentiment. | Important market events can drastically change the market condition, rendering the pattern analysis ineffective. | Stay updated with market news and economic events, and factor them into your trading strategy. |
| Forgetting the Basics | Neglecting fundamental principles like supply and demand, support and resistance levels. | Can lead to a one-dimensional view of the market, missing key factors that influence price movements. | Maintain a balanced approach by considering fundamental market principles along with candlestick patterns. |
Conclusion
To sum it up in trading terms, candlestick patterns are like pieces of a puzzle. They can provide valuable insights, but it’s important not to rely on them alone. Combining candlestick patterns with other tools, sticking with the trend, confirming patterns, staying updated with market news, and remembering the basics can lead to more successful trading.
Avoiding common mistakes ensures a smoother trading journey. So, use candlestick patterns wisely, and they’ll be a helpful part of your trading strategy.


wow