Definition
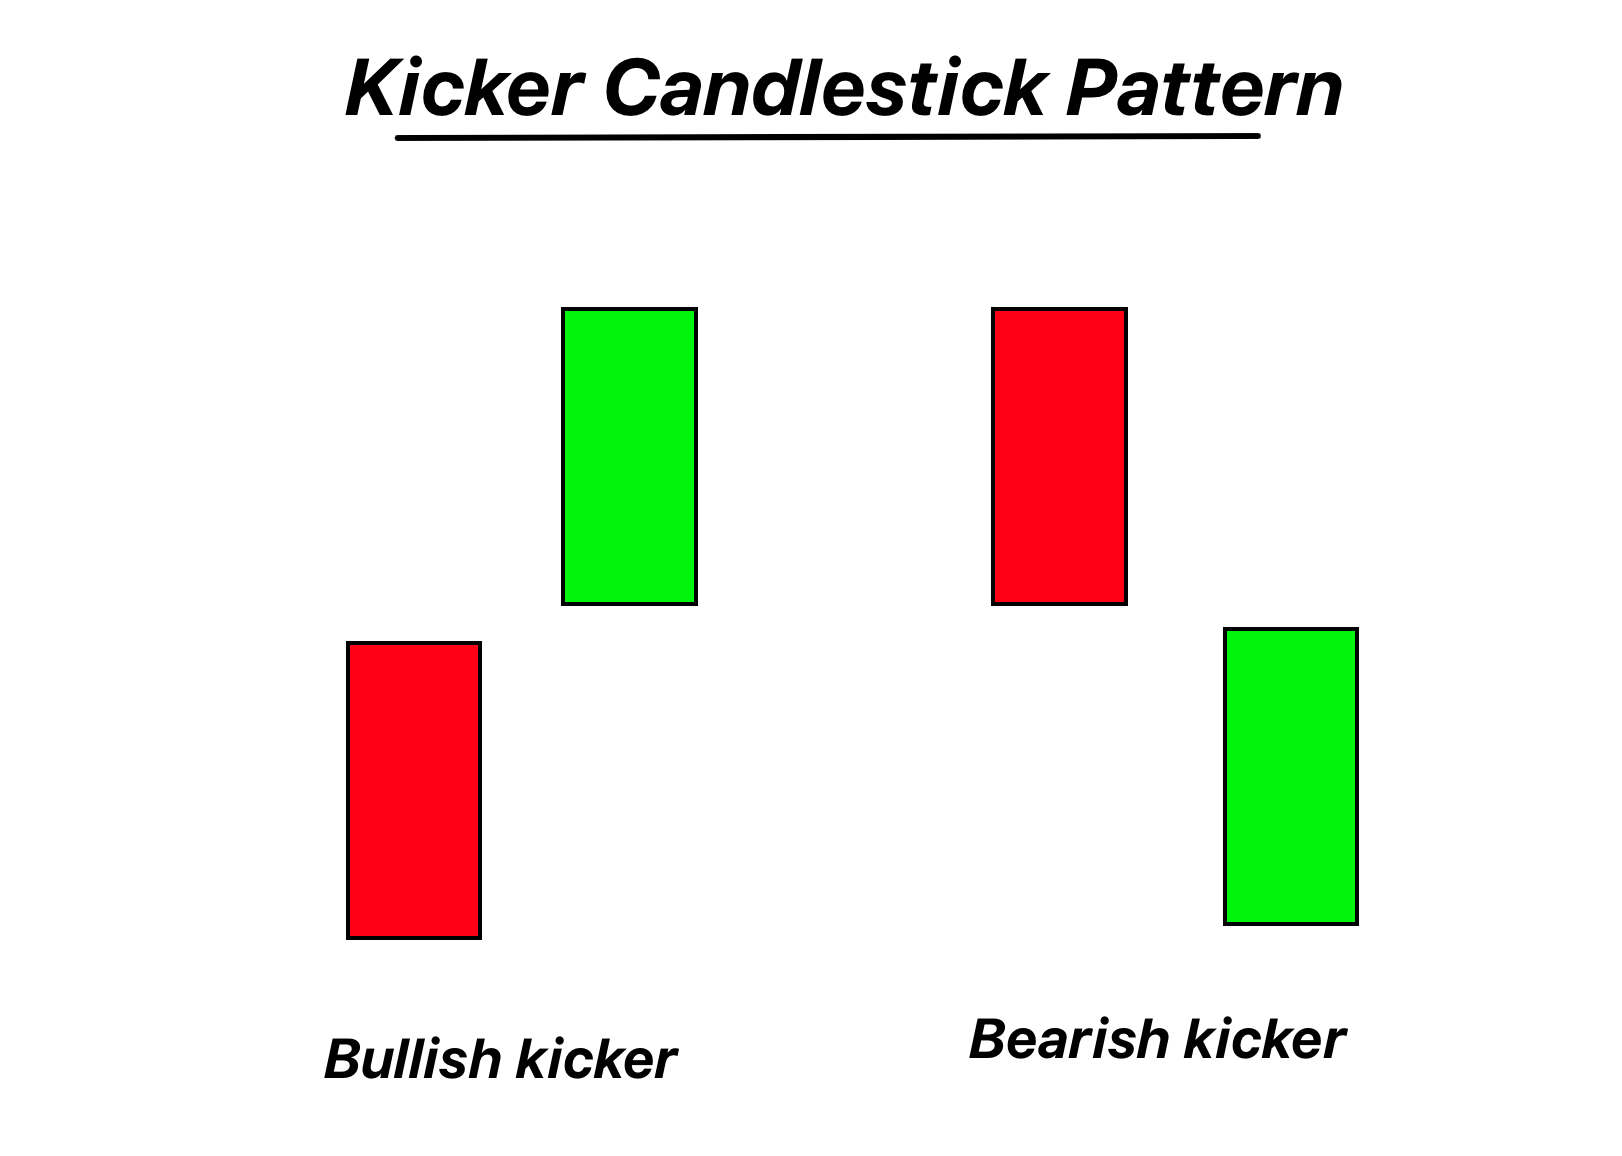
The Kicking candlestick pattern consists of two gap-separated marubozu candles in opposite directions, with the first indicating the prior trend and the second pointing to the new trend.
A powerful reversal signal, the Kicking pattern starkly captures a sudden and decisive change in trader sentiment, often precipitated by significant news or events affecting the market.
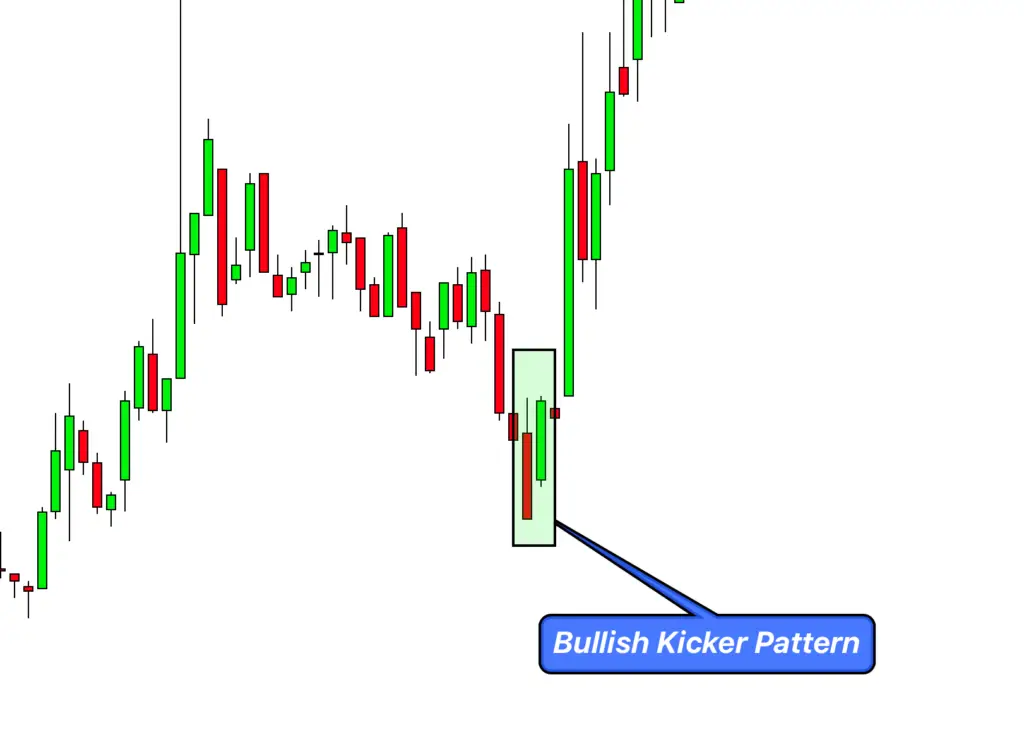
Identifying the Kicking Candlestick Pattern on a Chart
- Marubozu Candles: Look for two marubozu candles. A marubozu candle is one where there are no shadows (or extremely short shadows) from the body, meaning the opening and closing prices are at the extreme ends of the day’s range.
- Opposite Colors: The first marubozu should be the color of the prevailing trend (bearish/red for a downtrend and bullish/green for an uptrend), while the second marubozu should be the opposite color, indicating a change in trend.
- Price Gap: There should be a gap between the two marubozu candles, with no overlap in their ranges. This gap is pivotal as it accentuates the sudden shift in market sentiment.
- Directional Clarity: The pattern can be either bullish or bearish. A bullish Kicking pattern starts with a bearish marubozu followed by a bullish one. Conversely, a bearish Kicking starts with a bullish marubozu followed by a bearish one.
- Significant Volume: While not mandatory, it enhances the pattern’s reliability if there’s an increase in trading volume during its formation, especially on the second marubozu.
Significance and Indications of the Kicking Candlestick Pattern
Decisive Market Sentiment Shift:
At the heart of the Kicking pattern is a strong and abrupt sentiment shift. When this pattern emerges, it’s often a clear indication that the market participants have undergone a rapid change in perspective, typically fueled by an impactful external event or data release. For traders, this is an unmistakable sign that the prevailing trend is losing steam, and a new direction is taking hold.
High Reliability:
The Kicking pattern, given its stark appearance and the presence of a gap, is considered one of the more reliable reversal signals in candlestick charting. While no pattern guarantees a particular market move, the presence of the Kicking pattern tends to heighten the probability of a trend reversal. It’s this reliability that makes it a favorite among many traders.
Gap’s Role in Confirmation:
The gap between the two marubozu candles isn’t merely a feature of the pattern; it’s an integral part of its significance. Gaps in price charts often signify strong interest or disinterest in an asset, and when coupled with two powerful marubozu candles, it underscores the vigor of the sentiment shift.
Immediate Action Suggested:
When a trader spots a Kicking pattern, it usually suggests that prompt action may be necessary. Given its formation often in the wake of significant market news, waiting on the sidelines might mean missing out on the initial stages of the new trend.
Behind the Scenes: Big Traders’ Activity During the Kicking Pattern Formation
Prompt Reaction to News:
When a Kicking pattern forms, it’s often a direct consequence of institutional or “big” traders reacting quickly to significant market information. These traders have access to vast arrays of information and the capacity to interpret and act on it swiftly. The presence of the initial marubozu candle, especially when accompanied by high volume, might indicate their initial stance concerning the recent market developments.
Significant Position Adjustments:
The gap between the two marubozu candles isn’t just a random occurrence. It suggests that big traders are actively adjusting their positions, either closing out old trades or initiating new ones in anticipation of a new trend. This kind of substantial position adjustment can only result from the concerted activity of institutional traders, given their capacity to move the markets.
Liquidity Hunt:
One essential element to understand is that these large entities often seek liquidity for their trades, especially if they’re dealing with vast quantities of an asset. The swift reversal (depicted by the second marubozu) might be a scenario where these traders are triggering stop losses or inducing entries, creating a pool of liquidity to facilitate their substantial orders.
Sentiment Alignment:
By the time the second marubozu forms, there’s often a consensus among big traders about the market’s direction. This collective sentiment alignment can offer a more sustained move, as it’s not just a few entities but a majority of the market “whales” aligning their trades in a particular direction.
Confirmation Tools
| Tool | Description |
|---|---|
| Key Level Break | After the formation of the pattern, a break of significant support (in a bearish Kicking) or resistance (in a bullish Kicking) can reinforce the validity of the reversal. This demonstrates the market’s commitment to the new trend direction. |
| High Volume | An increased trading volume during or immediately after the pattern formation indicates strong participation and consensus among traders, adding weight to the reversal signal. |
| Momentum Indicators | Tools like the Relative Strength Index (RSI) or the Moving Average Convergence Divergence (MACD) can offer additional insight. For instance, if RSI was in an overbought zone before a bearish Kicking, it strengthens the reversal sign. |
| Follow-through Candle | After the Kicking pattern, a strong candle that continues in the direction of the reversal (without necessarily being another marubozu) can serve as confirmation. This shows sustained interest in the new trend direction. |
Trading Insights for the Kicking Pattern
Best Timeframe:
For the Kicking pattern, daily and weekly timeframes are often considered the most reliable. While it can appear on shorter timeframes like 1-hour or 4-hour charts, the significance of the pattern tends to increase with the duration of the timeframe, as it filters out intra-day noise and captures broader market sentiment.
Trading Session:
The Kicking pattern’s appearance can be influenced by major news events. Hence, it’s beneficial to be aware of major global sessions where such news might be released. For Forex traders, the overlap of the London and New York sessions can be particularly potent, while for equity traders, the initial hours after the opening bell can be indicative, given the potential for overnight news to affect sentiment.
Winning Ratio:
No candlestick pattern, including the Kicking pattern, guarantees a fixed winning ratio. However, when used with other confluence factors and confirmations, the Kicking pattern can yield a rough winning ratio of around 65-70%.
Trading Strategy with Confluence
1. Entry:
Look for additional confluence factors after identifying the Kicking pattern. If the pattern appears near a significant historical support or resistance level or aligns with Fibonacci retracement levels, it can serve as a stronger signal. Enter the trade when the subsequent candle post the Kicking pattern confirms the anticipated direction (i.e., a bullish candle for bullish Kicking and vice versa).
2. Stop-loss:
Place your stop-loss just beyond the opposite end of the second marubozu candle in the pattern. This ensures that if the pattern fails and price reverses, you’re quickly out of the trade with limited loss.
3. Take Profit Level:
The projected move can often be the length of the entire Kicking pattern. Measure the distance from the high to the low of the pattern and project that from the breakout point for a potential target. However, always monitor other significant levels or indicators that might suggest stalling momentum before this target is reached.
4. Add Confluence:
Integrate other tools for a more robust strategy:
- Momentum Indicators: If an oscillator like RSI was previously showing overbought conditions and then you spot a bearish Kicking, it adds to the pattern’s credibility.
- Volume: A spike in volume during the pattern’s formation indicates strong market participation and can be a vital confluence factor.
- Trendlines & Channels: If the Kicking pattern aligns with the boundary of a trendline or channel, it further confirms the anticipated price action.
Conclusion
The Kicking pattern, characterized by its distinct gap and strong marubozu candles, is a powerful visual representation of a swift shift in market sentiment. While no pattern offers guaranteed results, by integrating confluence factors and adhering to disciplined risk management, traders can harness the Kicking pattern’s potential for effective trading decisions.

