Definition
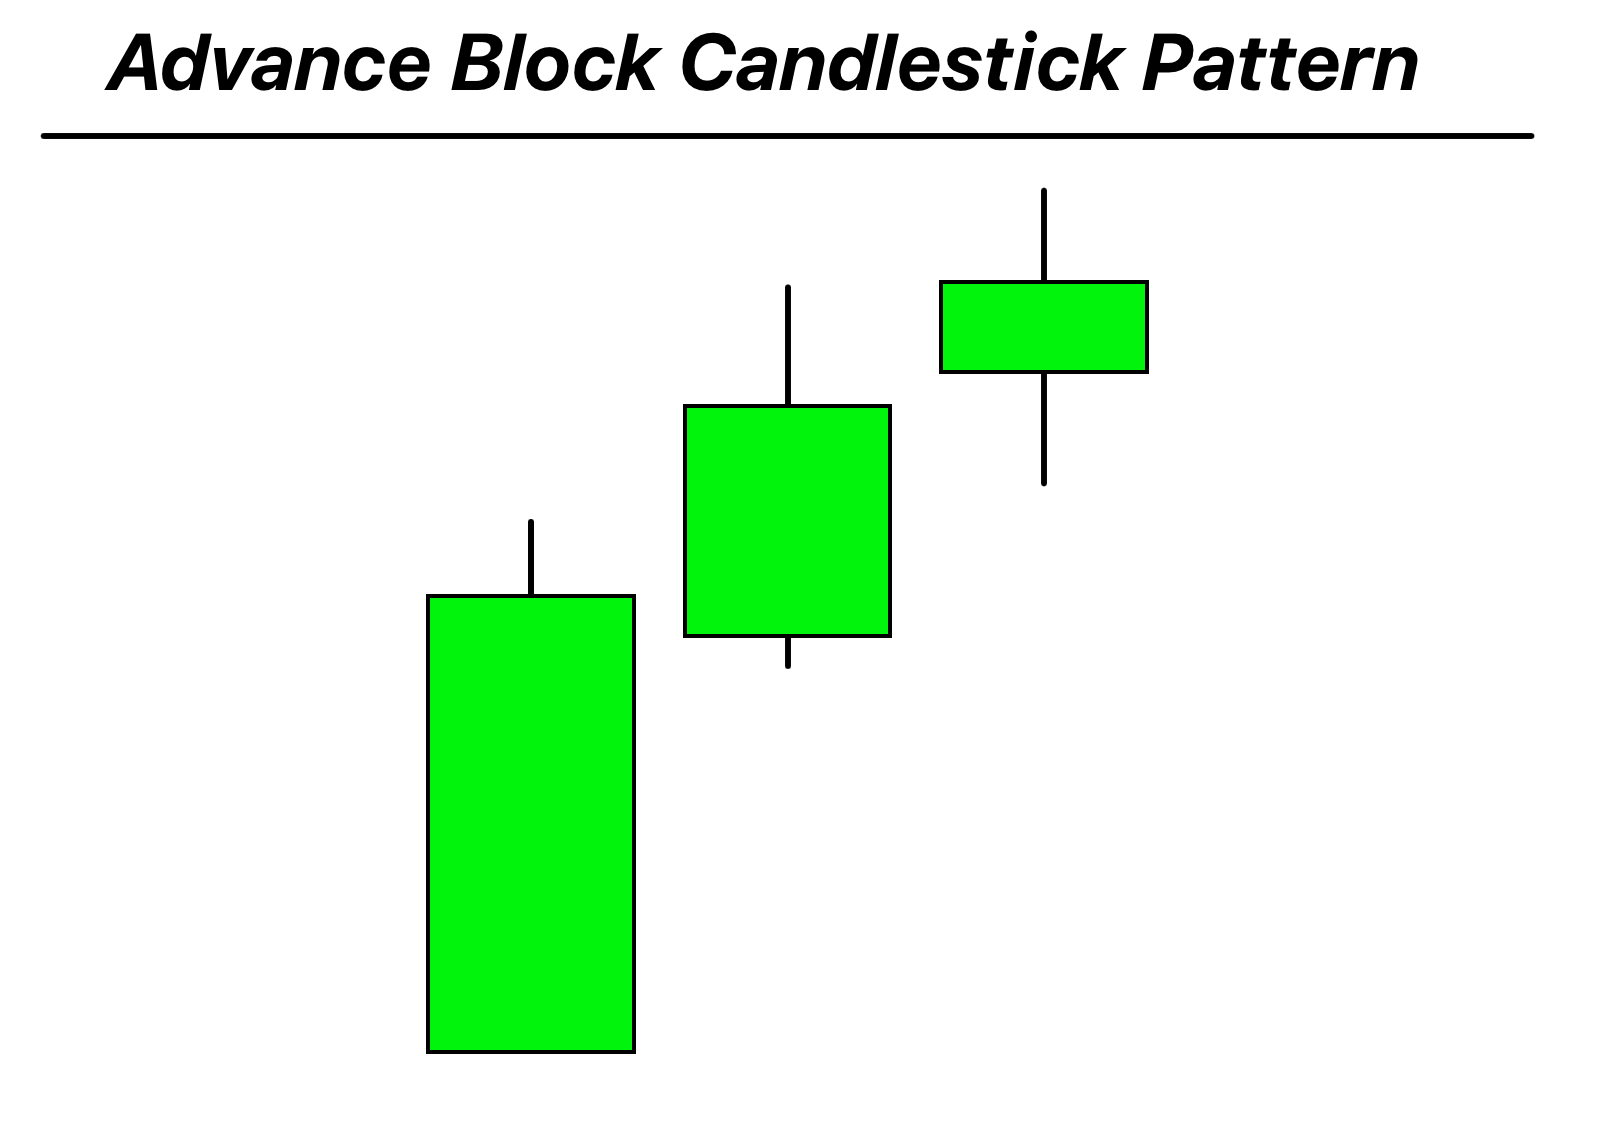
The Advance Block Candlestick Pattern consists of three consecutive white (or green) candles with each closing higher than the previous, but with progressively smaller real bodies and larger upper shadows, indicating potential bullish exhaustion.
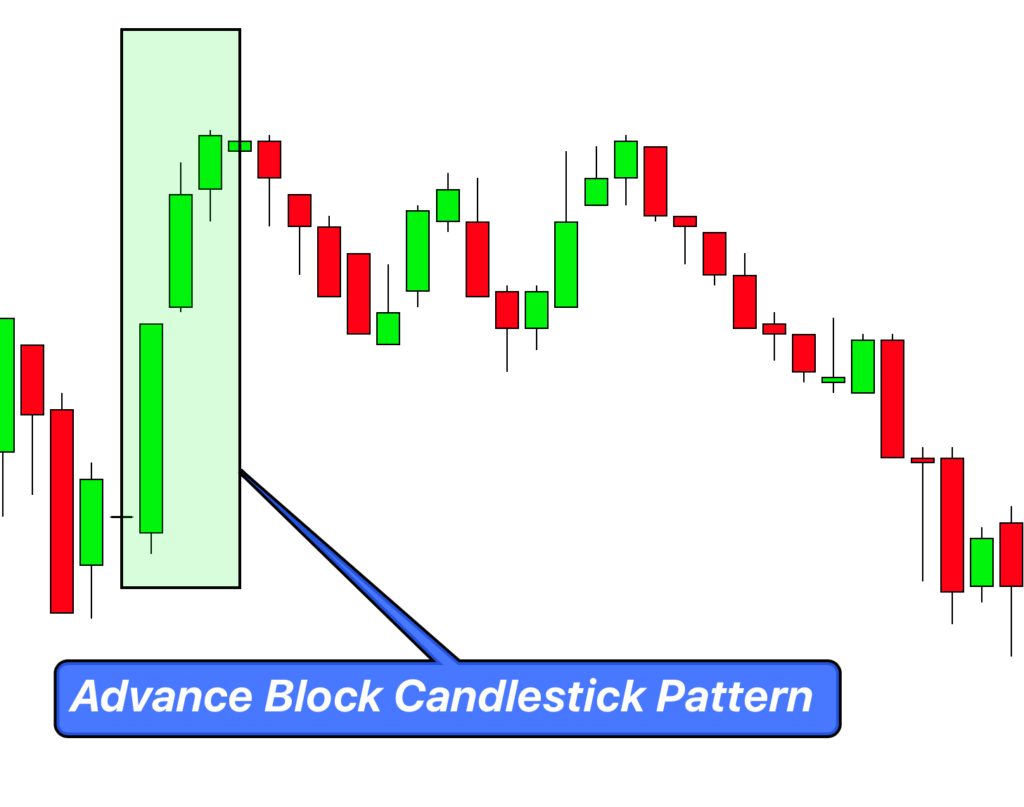
Often seen in uptrends, the Advance Block pattern warns traders of weakening bullish momentum and a potential trend reversal or consolidation ahead.
How to Identify the Advance Block Candlestick Pattern on a Chart
- Uptrend Precedence: Before the pattern emerges, there should be a clear uptrend in place.
- Three Consecutive Bullish Candles: Spot three white or green candles that form one after the other.
- Consecutive Higher Closes: Each of these three candles should close higher than the previous candle.
- Decreasing Real Bodies: The body (the portion between the open and close) of each successive candle should be smaller than the previous one. This means that the bullish momentum is slowing down.
- Increasing Upper Shadows: Each successive candle should have a longer upper shadow (the line above the real body) than the previous one, signaling that the bears are starting to push the price down before the close.
- Same or Increasing Volume: Ideally, the volume during these three days should be the same or increasing, which adds more validity to the weakening bullish momentum.
Significance and importance
The Advance Block Candlestick Pattern is a critical warning sign in trading, signaling the potential waning of bullish momentum. Recognizable by three consecutive bullish candles with diminishing real bodies and elongating upper shadows, this pattern suggests that although bulls are still in control, they are losing their grip as sellers begin to exert pressure. This evolving battle between buyers and sellers indicates that the once dominant bullish momentum may be reaching a point of exhaustion.
For traders, spotting this pattern offers a strategic advantage. It provides an early alert to potential market turns, allowing for timely adjustments – be it tightening stop losses or preparing for bearish positions.
Activity of big traders in the market during formation of advance block Candlestick
Understanding the activities of institutional or “big” traders during the formation of the Advance Block Candlestick Pattern can shed light on the underlying dynamics of the market.
When the Advance Block pattern materializes, it’s not merely a random occurrence. Instead, it reflects a subtle change in the tug-of-war between bulls and bears. Initially, the presence of three consecutive bullish candles might give the impression of a strong bullish sentiment. However, the intricacies of the pattern suggest otherwise.
In the world of institutional trading, sizeable positions often can’t be executed in a single move without causing significant market disruption. Therefore, they are distributed over time. During the formation of the Advance Block, while the market may still be posting higher highs – a bullish sign at face value – the progressively smaller real bodies and longer upper shadows of the candles indicate that these big traders might be taking profits or reducing their bullish bets. Each successive candle reveals a reduced ability of the bulls to push the price higher, and an increasing willingness of the sellers to step in at lower levels. This is an indication that institutional money might be seeing diminished upside potential or increased risk at these levels.
For retail traders, recognizing this activity can be invaluable. Instead of being misled by the apparent bullishness of consecutive green candles, they can glean insights into the potential strategic shifts of institutional players.
Confirmation Tools for the Advance Block Candlestick Pattern
| Tool | Description |
|---|---|
| Key Levels | Check for historical resistance or support levels. If the pattern forms near a significant resistance level, it adds credence to the potential reversal signal. |
| Break of Low After Pattern Formation | If the price breaks the low of the third candle following the pattern’s formation, it’s a bearish confirmation, suggesting that sellers have taken control. |
| High Volume | An increase in trading volume during the pattern formation indicates active participation. If volume surges as the pattern completes or as the low of the third candle is broken, it strengthens the bearish outlook. |
| Technical Indicators | Utilize oscillators like RSI or MACD. An overbought RSI, or a MACD bearish crossover during or after the pattern’s formation, can provide additional confirmation of waning bullish momentum. |
Trading Insights
Best Timeframe: For swing traders, the daily chart offers an optimal balance between signal reliability and trade frequency. However, for intraday traders, a 1-hour or 4-hour chart can be more fitting.
Trading Session: The pattern’s reliability is highest during the main trading hours of the underlying asset’s primary exchange, as this is when the bulk of institutional activity occurs.
Winning Ratio: While outcomes vary based on asset, market conditions, and confluence with other indicators, a well-executed Advance Block pattern strategy might offer a winning ratio in the ballpark of 60-70% when combined with rigorous risk management and confirmation tools.
Trading Strategy with the Advance Block Candlestick Pattern
Confluence Factors: Adding confluence factors to the Advance Block pattern increases its reliability. Look for:
- Other technical indicators, such as an overbought RSI or a MACD bearish crossover.
- Key support or resistance levels that align with the pattern.
- Fibonacci retracement levels that coincide with the pattern’s highs or lows.
Entry: Wait for a bearish candle to close below the low of the third candle in the Advance Block pattern. This break suggests that bears have taken control, and you can enter a short position.
Stop-Loss: Place the stop-loss slightly above the high of the third candle. This level acts as a buffer, ensuring you exit the trade if the bearish premise is invalidated.
Take Profit: A common profit target is the length of the largest candle in the pattern, projected downwards from the entry point. Alternatively, use key support levels or Fibonacci extensions to determine potential targets.
Conclusion
The Advance Block Candlestick Pattern offers traders a window into potential bullish exhaustion and upcoming reversals. However, its strength lies not just in its identification, but in its application with other confluence factors. Combined with rigorous risk management and strategic entry and exit points, this pattern can be a potent tool in a trader’s arsenal.

