Definition
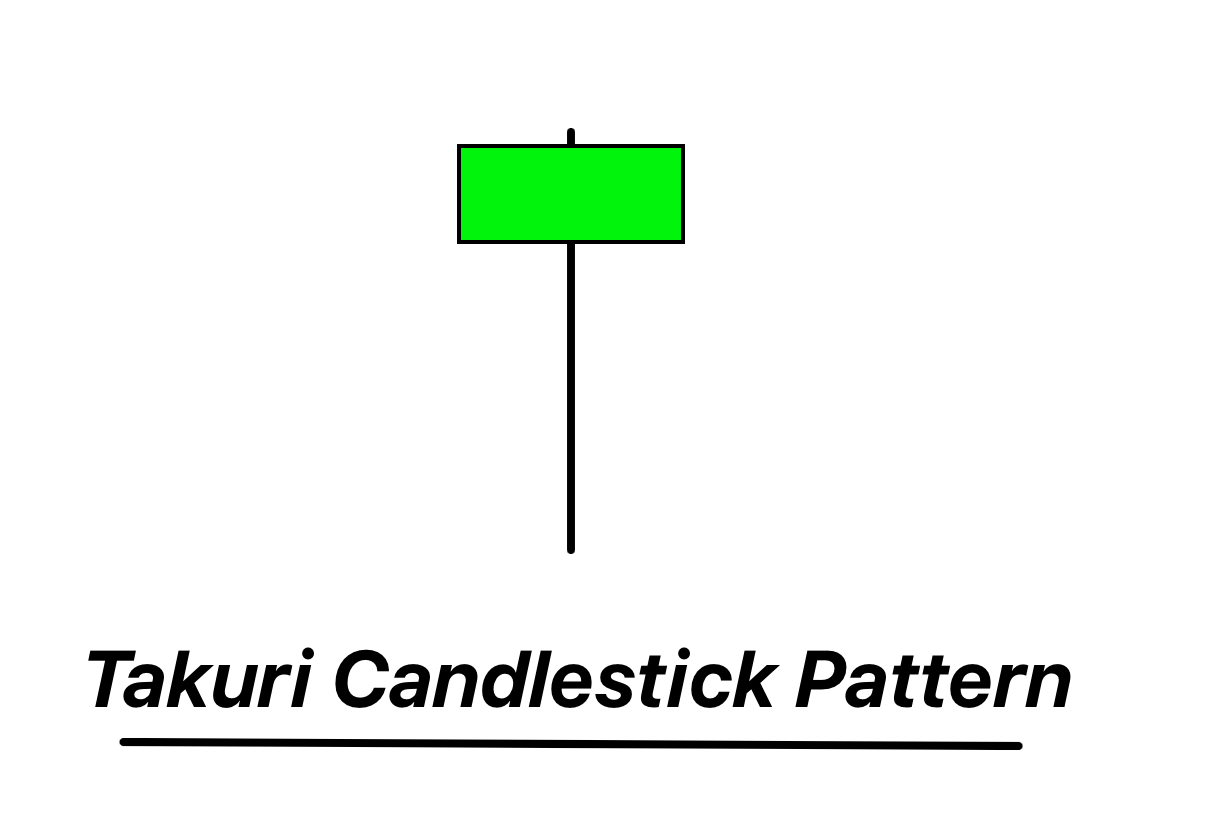
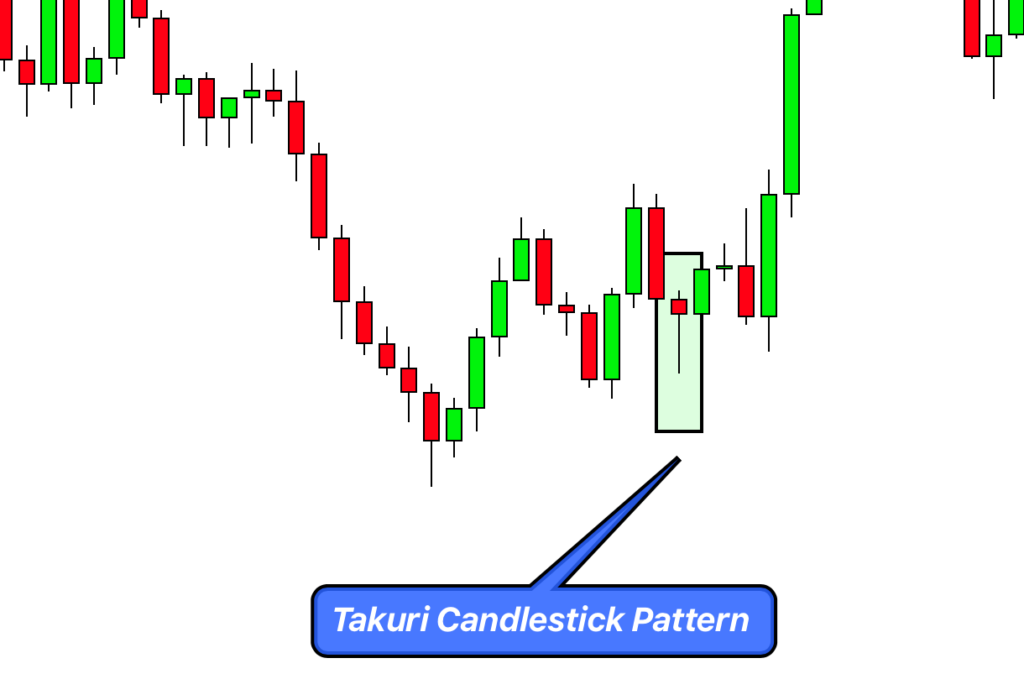
The Takuri candlestick pattern is a bullish reversal pattern that typically appears at the end of a downtrend, characterized by a long lower shadow and a short body that’s positioned above and near the top of the range.
A sign of potential market sentiment shift, the Takuri candlestick represents a fight back by buyers during a period of selling pressure, and can herald the start of a bullish trend.
Identifying the Takuri Candlestick Pattern
- Trend Prior: Look for the pattern during a confirmed downtrend. The Takuri pattern is a reversal pattern, meaning it signals a possible shift from a downward to an upward trend.
- Long Lower Shadow: The most defining feature of the Takuri pattern is the long lower shadow. This shadow should be at least two times longer than the body of the candlestick. It suggests that sellers were initially in control, but buyers managed to push the price back up.
- Small Body: The body of the candlestick, which is the area between the open and close price, should be small. It can be either red or green, although a green (or white) body may signal a stronger bullish reversal.
- Short or No Upper Shadow: The upper shadow of the Takuri pattern should be very small or nonexistent. This implies that the closing price was near the high of the day, indicating that buyers took control from sellers by the end of the period.
- Confirmation: To ensure that a reversal is indeed in play, look for a confirmation candlestick the following day that closes higher than the close of the Takuri candle. This adds further credence to the bullish reversal signal.
Significance and Market Implications
As a professional trader, the Takuri candlestick pattern holds immense significance for several reasons:
- Psychological Indication: The long lower shadow of the Takuri pattern signals a strong fight back from the bulls (buyers) against the bears (sellers) during a period of selling pressure. This can be a clear psychological indication of changing sentiment in the market, where the buyers start to take control.
- Potential Reversal Signal: The Takuri pattern is a bullish reversal pattern, occurring during a downtrend and hinting at a potential upcoming uptrend. Thus, it can be an early signal to traders to consider entering a long position or exiting a short position.
- Confirmation of Support Levels: If the Takuri pattern forms near a known or established support level, it can strengthen the validity of that support level. The long lower shadow shows that the price was pushed down but rebounded, indicating a strong buying pressure at that price level.
- Risk Management: The low of the Takuri pattern’s long shadow can be used to place stop-loss orders for risk management. If the price falls below this level after the pattern formation, it can be an indication that the bullish sentiment was not strong enough, and the existing downtrend is continuing.
- Strength of Signal: While the color of the body (red or green) does not matter as such for the Takuri pattern, a green (or white) body indicates a stronger bullish signal, as it shows that the closing price was above the opening price.
Big Traders’ Activity
As a professional trader, when you spot a Takuri candlestick pattern, it’s crucial to understand the activities of big traders or institutional investors, as their actions can significantly influence market direction.
- Sign of Big Traders’ Activity: The Takuri pattern, with its long lower shadow, indicates that during the period, prices were pushed down significantly only to rebound before the close. This suggests that larger traders may have stepped in to buy at the lower prices, seeing value, which can be a bullish sign.
- Institutional Buying: The close near the high of the range signifies a successful pushback by the buyers, which could indicate that institutional traders are accumulating positions and preparing for a possible uptrend.
- Indication of Panic Selling: The initial price drop that forms the long lower shadow could be a result of panic selling among retail traders. Big traders take advantage of these panic-driven prices and start accumulating, leading to the rebound.
- Volume Analysis: Check the trading volume on the day when the Takuri pattern forms. A high trading volume suggests that the pattern has strong support from big traders.
- Confirmation: Institutional investors often wait for confirmation of a trend reversal before fully committing, which can lead to increased buying pressure in the period following the Takuri pattern. If there’s a bullish candle following the Takuri pattern with increased volume, it could be an indication that big traders are supporting the upward movement.
Confirmation Tools
| Confirmation Tool | Description |
|---|---|
| Key Support Levels | The pattern forming near a known or established support level can provide a strong indication of the pattern’s reliability. The support level acts as a price floor, suggesting that buyers will step in if the price drops to this level. |
| Break of Low | If the price drops below the low of the Takuri candle’s long lower shadow after the pattern’s formation, it can be a bearish signal suggesting the continuation of the downtrend. This is a sign that the bullish sentiment may not be strong enough to reverse the trend. |
| High Trading Volume | High volume during the formation of the Takuri pattern can confirm the pattern’s strength. It suggests significant trading activity and potential interest from large traders or institutional investors. A high volume on the following bullish candle can further confirm the reversal signal. |
| Additional Bullish Candlestick Pattern or Price Action Signal | An additional bullish candlestick pattern or a positive price action signal like a bullish engulfing pattern or a pin bar after the Takuri pattern can provide further confirmation of a potential trend reversal. This can suggest the market’s acceptance of higher prices. |
Trading the Takuri Candlestick Pattern: Timeframe, Session, and Winning Ratio
Best Timeframe: The Takuri pattern can be identified in any timeframe, but it tends to be more reliable in higher timeframes like the daily or weekly charts. These larger timeframes often filter out market ‘noise’ and provide a clearer picture of price action.
Trading Session: This pattern is not specific to any trading session and can form in any market, be it Forex, stocks, or commodities. However, sessions with higher liquidity, such as the London or New York sessions for Forex, may provide more reliable signals.
Approximate Winning Ratio: While it varies depending on market conditions and the trader’s skill, when used alongside appropriate confirmatory signals and sound risk management, the Takuri pattern can offer a winning ratio of approximately 60-65%.
Takuri Candlestick Pattern: Trading Strategy with Confluence
Here’s a simple trading strategy incorporating the Takuri candlestick pattern with the addition of confluence factors:
Entry Point: Wait for the formation of a Takuri candlestick pattern during a downtrend. Then, seek additional confirmation such as a bullish candlestick pattern in the subsequent period or a relevant price action signal. Your entry point should ideally be at the opening price of the next candle after the confirmation.
Stop Loss: Set the stop loss slightly below the low of the long shadow of the Takuri pattern. This level represents a point where the market has shown significant buying pressure, and a break below it would invalidate the bullish reversal signal.
Take Profit Level: The take profit level depends on your risk-to-reward ratio and overall trading strategy. A common approach is to set the take profit level at a resistance level above the entry point or use a risk-to-reward ratio of at least 1:2.
Confluence Factors: For higher probability trades, look for confluence with other technical indicators. This could include a supportive trendline, a key Fibonacci level, or a divergence on an oscillator like the Relative Strength Index (RSI) or the Moving Average Convergence Divergence (MACD).
Conclusion
The Takuri candlestick pattern can be a powerful tool in a trader’s arsenal. It represents a potential shift in market sentiment, indicating a fight back by buyers during a period of selling pressure. However, as with all technical analysis patterns, the Takuri pattern is most effective when used in conjunction with other indicators and a well-planned risk management strategy. Always ensure you have clear rules for entry, stop loss, and take profit levels, and seek to add confluence factors to improve the probability of success in your trades.

