Definition
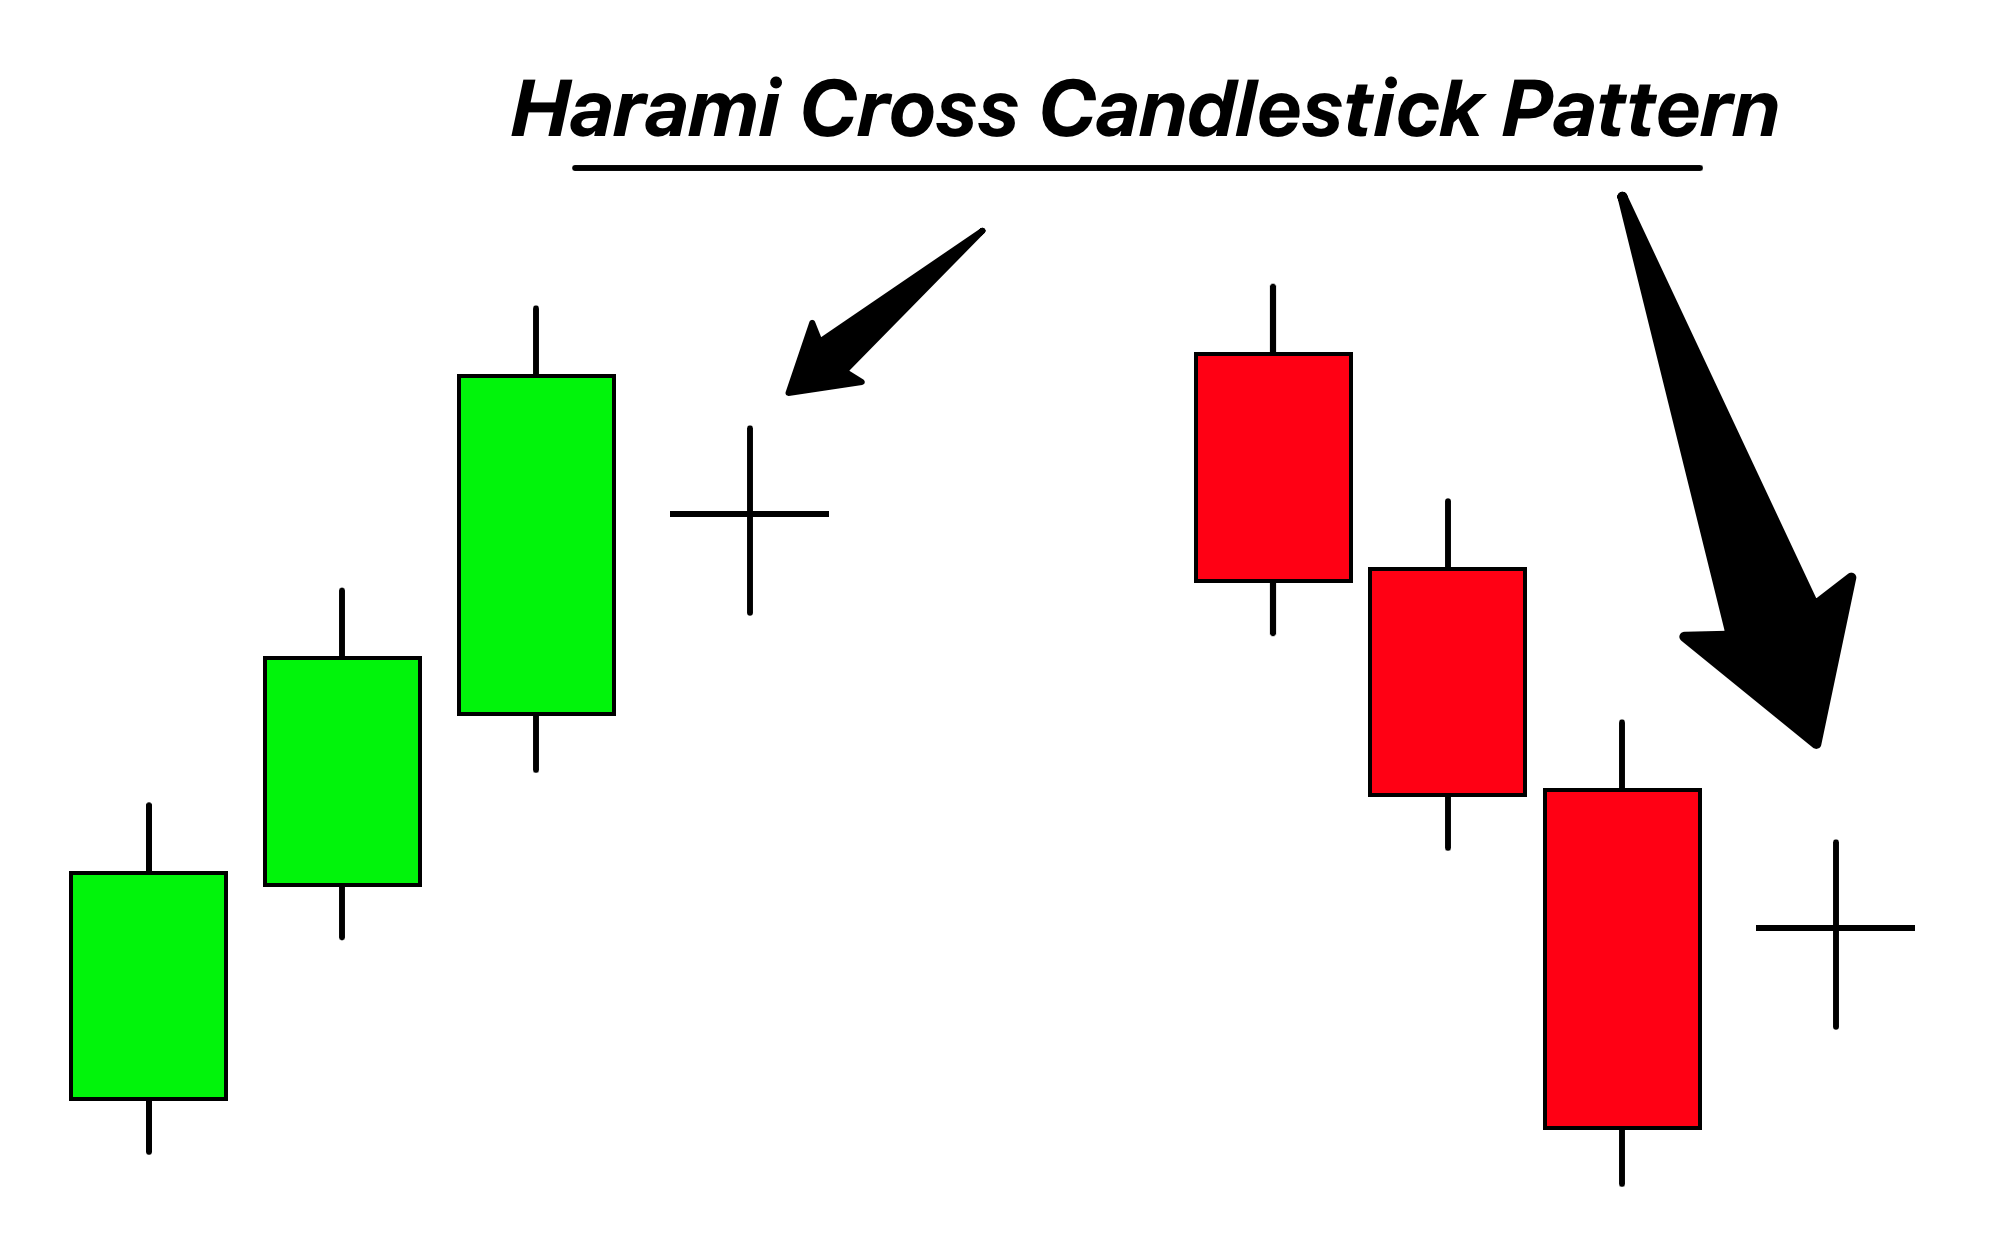
The Harami Cross is a two-candle pattern consisting of a large body candle followed by a doji that is completely encompassed within the range of the previous candle’s body.
The Harami Cross highlights indecision in the market after a strong trend and it suggests the possibility of a change in direction.
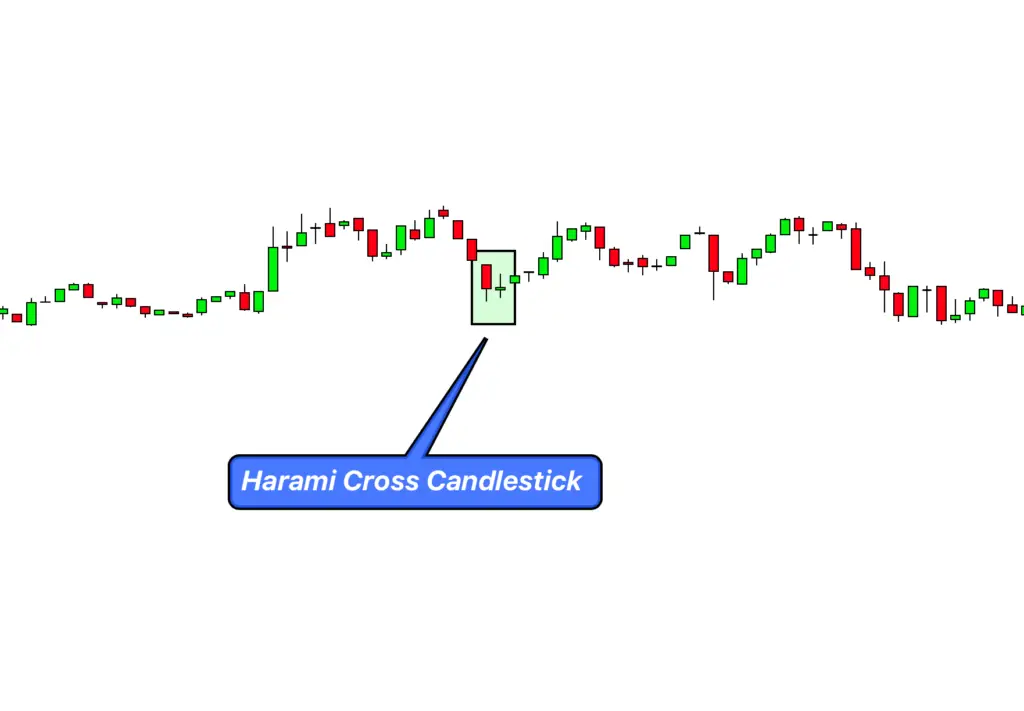
How to Identify the Harami Cross Candlestick Pattern on a Chart
- Prevailing Trend: Start by looking for a clear existing trend, either bullish or bearish. The Harami Cross acts as a potential reversal signal, so its presence within a pronounced trend is vital.
- First Candle:
- Bullish Trend: A long bullish candle, indicating the continuation of the uptrend.
- Bearish Trend: A long bearish candle, representing the continuation of the downtrend.
- Second Candle – The Doji:
- The subsequent candle after the long body candle should be a doji, which signifies market indecision.
- Crucially, the doji should be entirely contained within the range of the body of the first candle, meaning its high and low should not exceed the high and low of the previous candle’s body.
- Positioning of the Doji: While the doji’s position can vary within the first candle’s body, its location can offer additional insights:
- Closer to the top in a downtrend or the bottom in an uptrend can suggest a stronger reversal potential.
- Positioned in the middle, it signals strong indecision and a potential pause in the trend.
- Volume Consideration: Typically, the volume on the day of the doji will be lower than that of the preceding day, emphasizing the market’s uncertainty and indecision.
Significance and Importance
1. Trend Reversal Indication: The primary significance of the Harami Cross lies in its ability to signal a potential trend reversal. Following a strong trend, its appearance suggests that the trend might be losing steam, and a reversal or consolidation might be on the horizon.
2. Market Indecision Highlighted: The doji in the pattern embodies indecision in the market. After a pronounced trend (represented by the first candle), the doji signifies that neither the buyers nor sellers could gain an upper hand in the subsequent session.
3. Psychological Shift: From a psychological standpoint, after a strong move in one direction, the emergence of the Harami Cross demonstrates a shift in market sentiment. This shift suggests that traders and investors are re-evaluating their positions, potentially leading to a change in market direction.
4. Stronger than the Regular Harami: The Harami Cross is considered more significant than the standard Harami pattern. The presence of a doji, a clear symbol of indecision, accentuates the potential for reversal more than a small regular candle would.
Activity of Big Traders During the Formation of the Harami Cross Pattern
1. Re-Evaluation of Positions: The emergence of the Harami Cross, especially after a pronounced trend, suggests that institutional players might be reassessing their positions. This could be because of reaching a technical target, a change in fundamental outlook, or the exhaustion of the trend’s momentum.
2. Profit-Taking: The pattern might reflect initial stages of profit-taking by big players after a substantial move in their favor. The doji represents this equilibrium where buying and selling pressures temporarily balance out, often due to the exit of big traders from their positions.
3. Reduced Commitment: The Harami Cross, particularly the doji’s formation, indicates reduced commitment to the prevailing trend by institutional traders. This decrease could be due to a lack of new information or the anticipation of opposing market factors that might challenge the existing trend.
Harami Cross Pattern Confirmation Table
| Confirmation Tool | Description |
|---|---|
| Key Support/Resistance Levels | If the Harami Cross forms at a significant support (in a downtrend) or resistance (in an uptrend), its reversal potential is enhanced. These levels often act as barriers, indicating a strong likelihood of price reacting at these zones. |
| Break of High/Low Post-Pattern | After the pattern forms, a break of the high (in a downtrend) or the low (in an uptrend) of the Harami Cross provides a more definitive confirmation of the reversal. This break indicates a commitment from traders to the new direction. |
| Volume Analysis | A marked reduction in volume during the doji, compared to the preceding candle, indicates waning momentum. However, a subsequent increase in volume in the direction of the reversal can confirm the pattern’s validity. |
| Technical Indicators | Convergence or divergence with oscillators like RSI or MACD can strengthen the pattern’s signal. For instance, bullish divergence on RSI in a downtrend with a Harami Cross can indicate a stronger bullish reversal potential. |
Key Trading Parameters
Best Timeframe: For the Harami Cross, the Daily and 4-hour charts are optimal. These timeframes offer clarity and minimize market noise, ensuring the pattern’s true representation.
Trading Session: The pattern’s validity is heightened when it emerges during principal market sessions, notably the London or New York sessions, due to the enhanced liquidity and dominant institutional player activity.
Winning Ratio: With proper context and corroborating factors, the Harami Cross presents a winning ratio around 60-65%.
Harami Cross Confluence Trading Strategy
1. Confluence Factors:
- Support/Resistance Levels: Wait for the pattern to form near significant support (in a downtrend) or resistance (in an uptrend) levels.
- Technical Indicators: Look for signs like bullish divergence on RSI during downtrends or bearish divergence during uptrends to enhance the reversal signal.
- Volume Analysis: Seek a noticeable drop in volume on the doji day, followed by an increase in volume in the direction of the anticipated reversal as a confirmatory signal.
2. Entry:
- Bullish Reversal: Enter a long position when the price breaks above the high of the Harami Cross pattern, particularly if it’s supported by the above confluence factors.
- Bearish Reversal: Enter a short position when the price breaks below the low of the Harami Cross pattern, reinforced by the mentioned confluence factors.
3. Stop-Loss:
- Bullish Reversal: Place the stop-loss a few pips below the low of the Harami Cross pattern.
- Bearish Reversal: Position the stop-loss a few pips above the high of the Harami Cross pattern.
4. Take Profit:
- Set the initial take profit target at a risk-reward ratio of at least 1:2. This means if your stop-loss is 10 pips, aim for a 20 pip gain.
- For higher potential, traders can use trailing stops to let their profits run, adjusting the stop loss as the trade progresses in their favor.
Conclusion
The Harami Cross is a compelling candlestick pattern signaling potential market reversals. Its strength is magnified when combined with other technical tools, emphasizing the importance of confluence in trading. As with all strategies, maintaining sound risk management and keeping emotions in check is paramount to optimize its efficacy in live market conditions.

