Definition
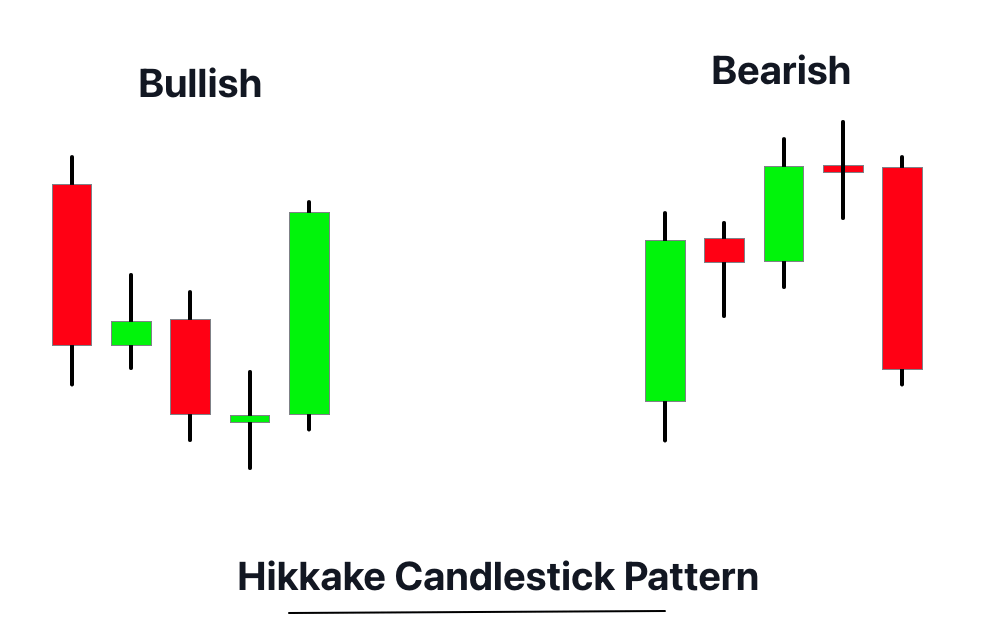
The Hikkake pattern is a deceptive price action setup that can indicate both bullish and bearish reversal or continuation scenarios, characterized by a failed inside bar breakout attempt.
The Hikkake primarily serves as a fakeout or trap setup. It operates by trapping traders into unfavorable positions by faking a breakout from an inside bar, then reversing the direction, catching the market off-guard.
How to identify the Hikkake Candlestick Pattern?
To identify the Hikkake pattern on a chart, follow these steps:
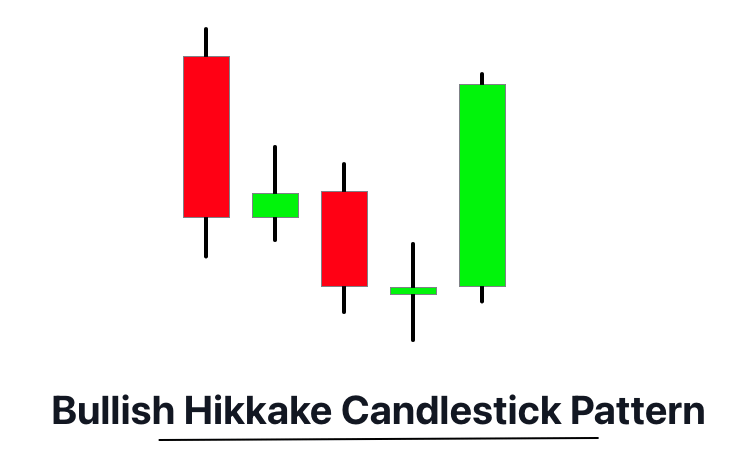
Bullish Hikkake
- Identify the Inside Bar: The setup begins with an inside bar formation, where the current bar’s high and low are within the range of the previous bar.
- False Breakdown: Look for the next bar to break below the low of the inside bar, which appears to be a bearish signal.
- Reversal: The bar after the false breakdown should close above the high of the previous bar, confirming the Hikkake pattern.
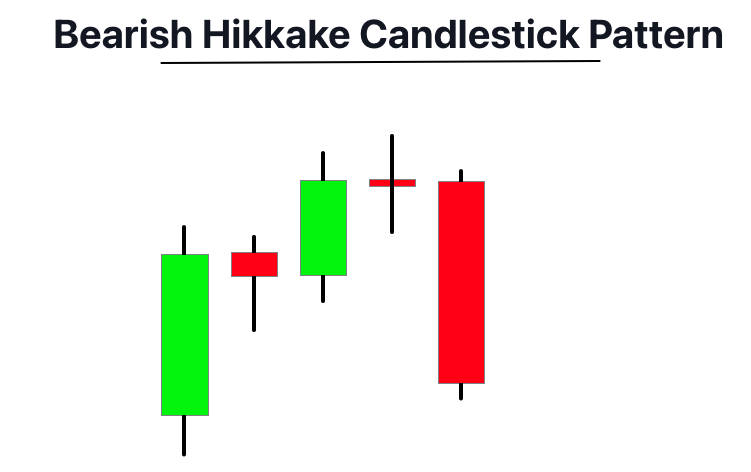
Bearish Hikkake
- Identify the Inside Bar: The pattern starts with an inside bar.
- False Breakout: The subsequent bar should break above the high of the inside bar, falsely indicating a bullish trend.
- Reversal: The following bar closes below the low of the previous bar, establishing the Hikkake pattern.
In both scenarios, the Hikkake pattern consists of three main components: the inside bar, the false breakout or breakdown, and the reversal bar. The sudden reversal is key to this pattern and often takes the market by surprise.
Significance
The Hikkake pattern is a compelling candlestick formation that indicates potential market reversals and deceptive trading situations. In Japanese, “Hikkake” translates to “hook, ensnare, trap,” hinting at its function as a trap for traders anticipating a conventional inside bar breakout.
In a bullish Hikkake, the pattern traps traders who went short after the false breakdown and then forces them to cover their shorts, driving prices higher. Conversely, a bearish Hikkake traps traders who went long after the false breakout, and as they sell off, prices drop.
The pattern’s significance lies in its ability to highlight areas where price action can shift direction, offering early entry points for trend reversals. Traders often employ this pattern as a standalone trading signal or in conjunction with other technical indicators to validate the signals.
Activity of market makers behind the chart
The Hikkake pattern is essentially a trap that involves big traders or institutions. When this pattern appears, it often signifies a trap set by these big traders to shake out weaker hands.
In the case of a bullish Hikkake, big traders may allow the price to fall below the low of the inside bar to bait bearish traders into going short. When these bearish traders commit, big traders, who had been accumulating positions, push the price back up, causing a short squeeze.
On the other hand, in a bearish Hikkake, big traders allow the price to rise above the high of the inside bar, enticing bullish traders. After the bullish traders have committed, the big traders who have been distributing their positions start to drive the price down, leading to long liquidations.
Understanding this behavior can help retail traders navigate the market more effectively, as they can observe these patterns and take positions in line with the big traders, rather than falling into the trap.
Confirmation tools
| Confirmation Tools for Hikkake Pattern | Description |
|---|---|
| Key Level | This pattern gains more credibility when it forms near significant support or resistance levels. |
| Break of Low/High After Pattern Formation | In a bullish Hikkake, the price should break above the high of the pattern after its formation. For a bearish Hikkake, the price should break below the low of the pattern after its formation. |
| High Volume | An increase in volume during the break of the high/low gives additional confirmation as it indicates strong participation by traders. |
| Additional Candlestick Confirmation | Additional bullish or bearish candlesticks following the Hikkake pattern can provide further confirmation. For example, a bullish engulfing candle after a bullish Hikkake or a bearish engulfing candle after a bearish Hikkake can add more validity to the trade. |
Note: All these tools should not be used in isolation but in confluence with the overall trend, the pattern itself, and other technical analysis tools.
Key points to remember
Best Timeframe: The Hikkake pattern can be observed in various timeframes but is most effective on daily and hourly charts, where its significance is magnified due to the larger data set.
Trading Session: The Hikkake pattern isn’t bound by a particular trading session and can form during any market hours. However, sessions with higher liquidity such as the London and New York overlap might offer higher quality signals due to increased market participation.
Winning Ratio: The success rate of the Hikkake pattern varies depending on the overall market context, the confluence factors, and the trader’s execution. In a favourable setup, it can offer a winning ratio between 60%-70%.
Trading Strategy
- Entry: Wait for the Hikkake pattern to form at a significant support or resistance level. The entry should be taken at the break of the high (for bullish Hikkake) or the low (for bearish Hikkake) of the bar following the inside bar.
- Stop Loss: The stop loss should be placed below the low (for bullish Hikkake) or above the high (for bearish Hikkake) of the pattern.
- Take Profit: The profit target can be set at a previous swing high/low or calculated using a risk-to-reward ratio of at least 1:2, meaning you aim to gain twice the amount risked.
- Confluence: Add confluence to increase the probability of the trade working out. This could include aligning your Hikkake trade with the overall trend, at key support/resistance levels, or using additional indicators like the RSI or MACD to confirm the trade.
Conclusion
The Hikkake pattern is a versatile trading tool, providing opportunities to trade within a range or catch breakouts. It’s crucial to understand that while the Hikkake pattern can be powerful, no pattern works 100% of the time. It’s always best to use it in conjunction with other forms of technical analysis to increase the chances of success. Be patient, wait for the right setup, and always manage your risk.

