Definition:
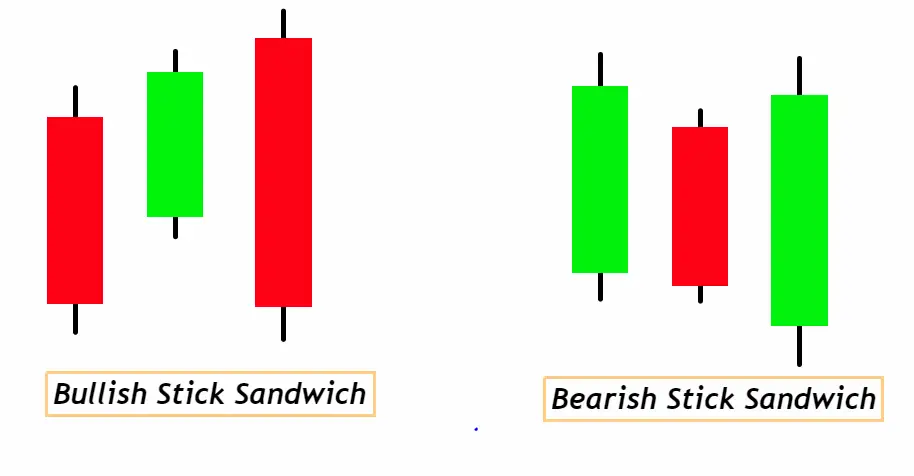
The Stick Sandwich Candlestick Pattern is a three-day trading pattern consisting of one red candle flanked by two green candles, or one green candle flanked by two red candles, signaling a potential reversal of the current trend.Commonly found in trending markets, the Stick Sandwich pattern can serve as an early indication of a potential trend shift, providing traders with insights for potential entry or exit points.
How to Identify the Stick Sandwich Candlestick Pattern on a Chart:
- Three-Day Sequence: Look for a sequence of three consecutive candlesticks on your chart.
- First Candle:
- In a bullish reversal, this should be a red (or black) candle, indicating a down day.
- In a bearish reversal, it should be a green (or white) candle, indicating an up day.
- Second Candle:
- For a bullish reversal, this should be a green (or white) candle that closes higher than the first candle, indicating a strong up day.
- For a bearish reversal, it should be a red (or black) candle that closes lower than the first candle.
- Third Candle:
- In a bullish pattern, this should be another red (or black) candle, similar to the first one. Importantly, it should close at or around the same price as the first candle.
- In a bearish pattern, it should be another green (or white) candle, similar to the first one, closing at or around the same price.
- Trend Precedence: Before the pattern, there should be a clear trend present. For a bullish reversal pattern, a downward trend should be evident. For a bearish reversal, an upward trend should be in place.
- Volume Check: Ideally, trading volume should increase during the second candle, indicating strong interest in the direction of its move.
By focusing on these points, traders can more easily spot the Stick Sandwich pattern and assess its potential implications for the market’s future direction.
Significance of the Stick Sandwich Candlestick Pattern:
- Reversal Indication: One of the primary significances of the Stick Sandwich pattern is its role as a potential reversal signal. When identified after a distinct trend, this pattern suggests a potential halt and reversal in the current direction. This can be especially valuable for traders who are vigilant about timely entries or exits and want to capitalize on early signs of a trend shift.
- Validation Through Repetition: The sandwiching effect, where the third candlestick mirrors the first, provides a kind of validation or confirmation of market sentiment. The fact that the market returns to a similar closing price after a contrary move on the second day suggests a degree of resistance (in a downtrend) or support (in an uptrend). This lends more weight to the pattern’s reversal indication.
- Volume Insight: Trading volume accompanying this pattern can offer additional insights. An increased volume during the second candle (the contrary move) suggests strong participation in the counter-trend, lending more credibility to the reversal indication. Monitoring volume helps traders gauge the conviction behind the potential trend change.
- Risk Management: For new traders, recognizing patterns like the Stick Sandwich can be instrumental in risk management. Once spotted, traders can adjust stop-loss orders or reconsider their market position, ensuring they are aligned with potential market moves, thus minimizing potential losses and maximizing gains.
In essence, the Stick Sandwich pattern serves as a beacon, highlighting potential shifts in market sentiment. Its structured appearance and the validation it offers make it a potent tool in a trader’s analytical arsenal, providing key insights for informed trading decisions.
Activity of Big Traders and the Stick Sandwich Candlestick Pattern:
- Initial Sentiment Follow-Through: The formation of the first candle, whether bullish or bearish, is typically a continuation of the prevailing trend. During this phase, large institutional traders or “smart money” might be closing out positions, taking profits, or even establishing new positions in anticipation of the trend continuation.
- Counter Move & Potential Liquidation: The appearance of the second candle, which moves counter to the existing trend, is crucial. This can be interpreted as institutional players testing the waters or initiating contrary positions. Sometimes, it can also represent a liquidation phase where big traders might be closing their positions due to various factors, like key news events or macroeconomic data releases. This counter move, backed by increased volume, can signify strong participation by big traders.
- Return to Original Sentiment & Validation: The formation of the third candle, which mirrors the first, suggests a return to the initial sentiment. This could be because the larger traders find the current price levels attractive for re-entry (if they had previously exited) or might be validating their previous positions. If they were testing the market’s resilience with the counter move, the third candle can indicate that their test found solid support or resistance, solidifying their conviction.
- Hidden Accumulation or Distribution: Sometimes, the Stick Sandwich pattern can also represent stealthy phases of accumulation (in a downtrend) or distribution (in an uptrend) by institutional players. For instance, in a downtrend, big traders might be discreetly buying or ‘accumulating’ assets during this pattern, while in an uptrend, they could be silently selling or ‘distributing’ their holdings.
Understanding the actions of institutional or big traders during the formation of patterns like the Stick Sandwich can offer retail traders a deeper insight into the market’s mechanics. Rather than just viewing candlestick patterns as mere shapes, discerning the psychology and strategy behind these formations allows for a more nuanced and effective trading approach.
Stick Sandwich Pattern Confirmation Table
| Tool/Indicator | Confirmation Insight |
|---|---|
| 1. Key Levels (Support/Resistance) | If the pattern forms near established support (for bullish reversal) or resistance (for bearish reversal) levels, the likelihood of a successful reversal increases. Key levels act as a cushion or ceiling, amplifying the pattern’s significance. |
| 2. Break of Low/High After Pattern Formation | For a bullish reversal, a break above the high of the Stick Sandwich pattern confirms bullish sentiment. Conversely, for a bearish reversal, a break below the low of the pattern reinforces the bearish outlook. |
| 3. High Volume | An increase in trading volume, especially during the formation of the second candle, indicates stronger market participation and lends more credibility to the pattern’s reversal indication. A continuation of high volume after the pattern might further validate the reversal. |
| 4. Technical Indicators (e.g., RSI, MACD) | Utilizing indicators can add another layer of confirmation. For instance, an oversold RSI during a bullish Stick Sandwich suggests a potential upward reversal, while an overbought RSI during a bearish pattern hints at a potential downward turn. Similarly, a MACD crossover aligning with the pattern can further bolster confidence in the reversal. |
By integrating these tools and indicators alongside the Stick Sandwich pattern, traders can achieve a more comprehensive view of the market and increase their probability of successful trades.
Stick Sandwich Pattern Trading Insights:
Best Timeframe: The Daily chart offers a balance between reliability and frequency for the Stick Sandwich pattern. Patterns on daily charts tend to filter out intraday noise, ensuring a more robust representation of market sentiment.
Trading Session: While the pattern can emerge in any session, its significance is accentuated during major market sessions, such as the New York or London sessions, due to higher liquidity and institutional participation.
Winning Ratio: Although outcomes vary based on market conditions and overall strategy, with proper confirmation tools and disciplined risk management, traders can expect a winning ratio of approximately 60-70% when trading the Stick Sandwich pattern.
For optimal results, always align your strategy with the broader market context and utilize additional confirmatory indicators.
Stick Sandwich Pattern Trading Strategy with Confluence:
1. Entry:
- Bullish Reversal: Enter a long position when a bullish Stick Sandwich pattern forms near a key support level, and there’s a break above the high of the third candle.
- Bearish Reversal: Initiate a short position when a bearish pattern is spotted near a resistance level and there’s a break below the low of the third candle.
2. Stop Loss:
- Bullish Reversal: Place the stop loss just below the low of the third candle or below the identified support level, whichever is lower.
- Bearish Reversal: Position the stop loss just above the high of the third candle or above the identified resistance level, whichever is higher.
3. Take Profit Level:
- Set your target profit based on a risk-reward ratio that you’re comfortable with, such as 1:2 or 1:3. For instance, if your stop loss is 20 pips away from your entry, consider setting your take profit at 40 or 60 pips.
- Alternatively, use significant support and resistance levels as markers for potential take profit zones, adjusting to maintain a favorable risk-reward ratio.
Confluence Factors:
- Technical Indicators: A confluence with other technical indicators like RSI, MACD, or Stochastic Oscillator can strengthen your trade decision. For instance, an oversold RSI in conjunction with a bullish Stick Sandwich can increase the probability of a successful trade.
- Trend Lines & Moving Averages: If the pattern forms around established trend lines or critical moving averages (like the 50 or 200-day MA), this can serve as an added layer of confluence.
Conclusion:
The Stick Sandwich pattern, while a potent signal on its own, exponentially gains credibility when combined with confluence factors. By aligning your trading strategy with these complementary tools, you not only enhance the probability of success but also develop a well-rounded approach to market analysis. As always, prudent risk management remains the bedrock of any successful trading endeavor.

