Definition
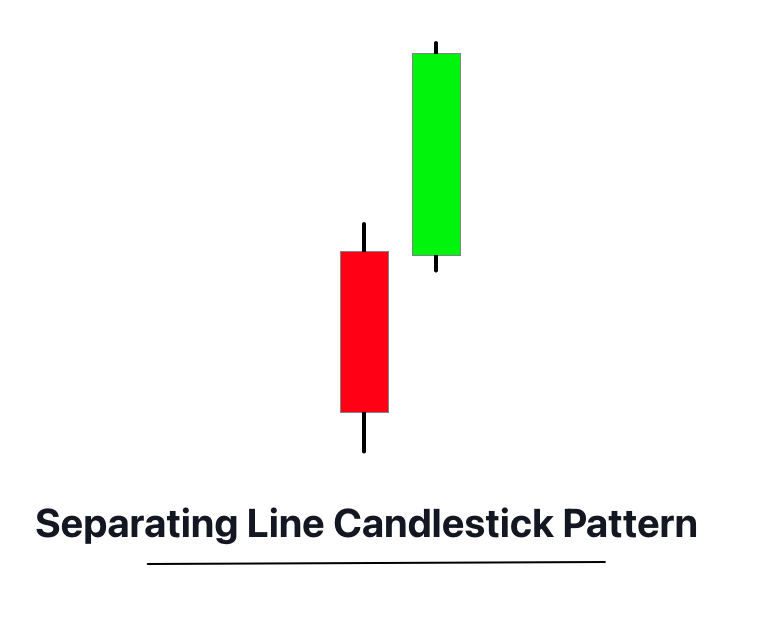
The Separating Lines Candlestick Pattern is a two-bar pattern where the first bar is a long black/red (in a downtrend) or white/green (in an uptrend) and the second bar is of the opposite color but opens at the same level as the first bar’s opening price.
The Separating Lines Pattern is a rare reversal candlestick pattern, seen infrequently but worth noting due to its potential to signal significant market reversals when appearing at the end of a prolonged trend.
How to identify the Separating Lines Pattern?
To identify the Separating Lines Candlestick Pattern on the chart, traders should look for the following features:
- Trend Identification: The pattern occurs during a trending market, either bullish or bearish. For a bullish separating line, it appears in a downtrend, and for a bearish separating line, it appears in an uptrend.
- Two-Bar Pattern: It consists of two candlesticks, the first candlestick is a long one in the direction of the preceding trend, and the second one is a contrasting color candlestick.
- Same Opening Prices: The opening price of the second day is the same as the opening price of the first day.
- Contrasting Closes: For a bullish separating line, the second candlestick closes higher than it opens, contrasting the first candlestick. For a bearish separating line, the second candlestick closes lower than it opens, contrasting the first candlestick.
- Verification of the Trend Reversal: The trend reversal is confirmed if prices continue to move in the direction of the second candlestick.
By following these guidelines, traders can easily spot the Separating Lines Pattern and make informed decisions about their trades.
Significance
The Separating Lines Candlestick Pattern is a significant indicator in technical analysis, signaling a potential trend reversal in the market.
For a Bullish Separating Line, it indicates that the ongoing downward momentum may be coming to an end, and an upward price movement is imminent. This is demonstrated by a strong positive candle that opens at the same price as the previous negative candle, showing the market participants are no longer willing to sell at lower prices and the buyers are stepping in.
Conversely, the Bearish Separating Line is an indication of a possible downward shift in an upward trending market. It depicts that despite an upward trend, the sellers are gaining control, and a downslide may be on the horizon. This is shown by a strong negative candle that opens at the same price as the previous positive candle, indicating a potential sell-off.
Both forms of Separating Lines suggest a potential change in market sentiment, highlighting an opportunity for traders to adjust their positions according to the predicted direction.
Activity of market makers behind the chart
When the Separating Lines Candlestick Pattern is formed, it signifies a shift in the behavior of large institutional traders or ‘big traders.’
In a Bullish Separating Line, big traders are usually reassessing their bearish stance and could start initiating long positions. This is reflected in the price opening at the same level as the previous day’s close, followed by a strong upward move. This suggests that these traders are no longer interested in selling at lower prices and are starting to buy, reversing the trend.
In the case of a Bearish Separating Line, big traders are likely to be rethinking their bullish perspective and could be preparing to take short positions. The price opens at the same level as the previous day’s close, but this time followed by a strong downward move, implying that these traders are offloading their positions and potentially driving the price down.
Confluences
By using these confluences, you can find high probability separating lines candlestick pattern.
| Confirmation Tool | Description |
|---|---|
| Key Level | Look for this pattern at a significant support or resistance level. The validation of this level can increase the reliability of the pattern. |
| Volume Analysis | High volume during the pattern formation can confirm the robustness of the signal. Specifically, a surge in volume on the day of the second candle (in the direction of the trend reversal) can serve as a strong confirmation. |
| Break After Pattern Formation | A break above the high of the bullish pattern or below the low of the bearish pattern after the pattern formation can confirm the anticipated price move. |
| Momentum Indicators | Use momentum indicators like RSI or MACD. In a bullish pattern, look for a bullish divergence in these indicators. In a bearish pattern, seek a bearish divergence. |
Key Points
Best Timeframe: The Separating Lines candlestick pattern can be identified on all timeframes but tends to be more reliable on the daily and weekly charts as they incorporate more data points, reducing the noise and increasing the pattern’s reliability.
Trading Session: This pattern is universal, thus can be applied in any trading session including the New York, London, or Asian sessions. However, the liquidity and volatility during the London and New York sessions can provide more opportunities.
Winning Ratio: As with all candlestick patterns, the winning ratio is dependent on the trader’s skill, risk management and the market conditions. However, with proper confirmation tools and strategy, it is possible to achieve a winning ratio of around 60-65%.
Trading Strategy
Entry: Once you’ve identified the Separating Lines pattern, look for additional confluence with support or resistance zones to enhance the reliability of the pattern. If the pattern forms at a support level in an uptrend (bullish Separating Lines), consider going long at the opening of the next candle after the pattern. Similarly, if the pattern forms at a resistance level in a downtrend (bearish Separating Lines), consider going short at the opening of the next candle.
Stop Loss: Set your stop loss slightly below the low of the pattern for a bullish setup and slightly above the high of the pattern for a bearish setup. This allows some room for price to move without getting stopped out prematurely.
Take Profit: Aim for a risk-reward ratio of at least 1:2. That is, if your stop loss is 20 pips away from your entry point, your take profit should be at least 40 pips away.
Conclusion
The Separating Lines candlestick pattern is a reliable indicator of potential price reversals, providing an insightful representation of the market’s psychology. However, its strength lies in its use in conjunction with other technical analysis tools, such as support/resistance levels, trendlines, or technical indicators. Always remember, no pattern provides a guaranteed outcome, and effective risk management should always be a key component of any trading strategy.

