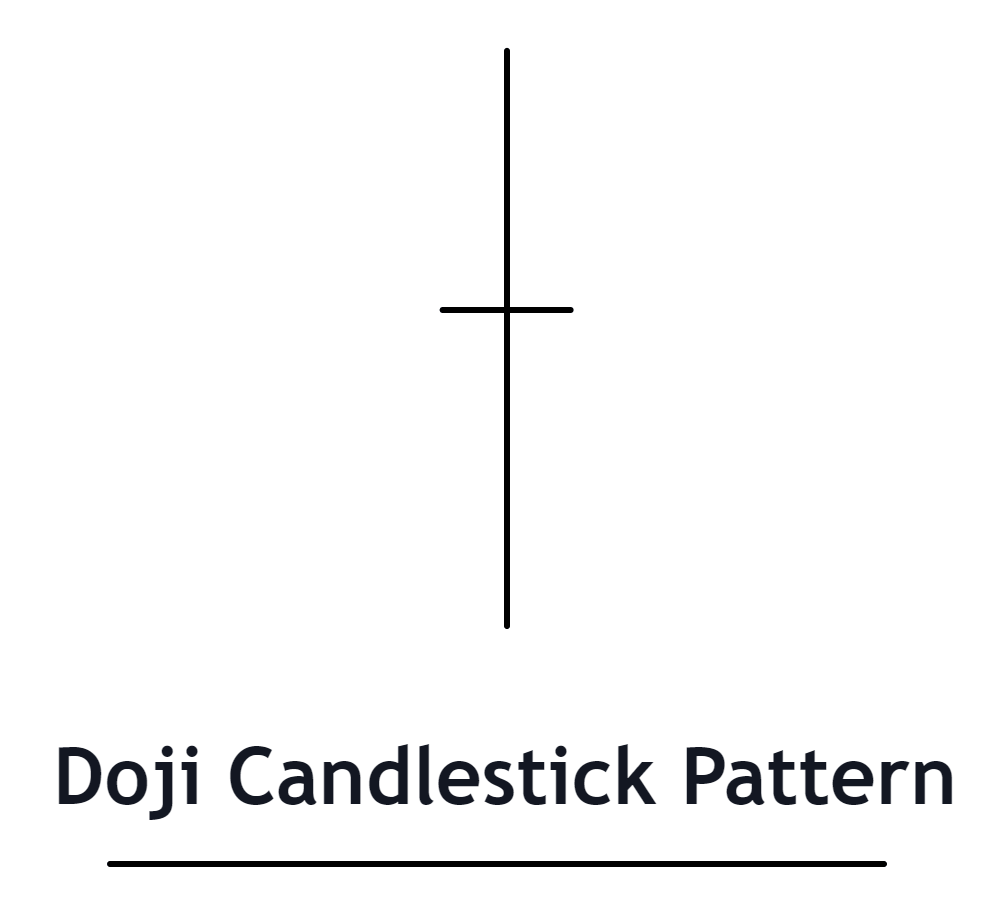
A Doji candlestick is a pattern where the opening and closing prices are virtually the same, resulting in a very thin or non-existent body, and typically having long shadows on both ends, symbolizing market indecision.
This candlestick indicates a tug-of-war between buyers and sellers where neither has managed to gain dominance, often marking potential reversal points in the market.
Structure of Doji Candlestick
Identifying a Doji candlestick pattern on a chart involves understanding its key components:
- Body of the Candlestick: A Doji has a very thin or non-existent body. This means that the opening and closing prices are virtually identical. On a chart, the Doji will appear as a thin horizontal line.
- Shadows (Wicks): Doji candlesticks typically have long shadows (or wicks) above and below the body. These shadows represent the high and low prices reached during the given timeframe. However, it’s important to note that the length of the shadows can vary.
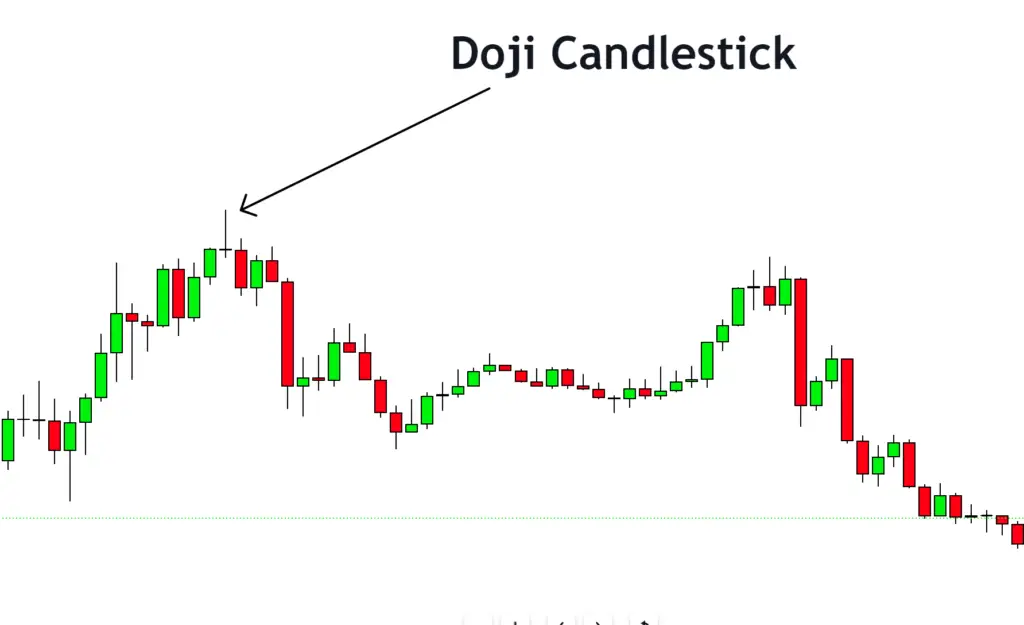
- Preceding Trend: The Doji is significant when it appears after a consistent uptrend or downtrend. It can indicate that the previous trend is losing momentum and that a reversal may be imminent.
- Position on the Chart: Look for Dojis that occur at the peak of an uptrend or the bottom of a downtrend. This positioning can suggest an impending shift in market sentiment.
Significance
The Doji candlestick pattern holds significant meaning for traders. Its primary significances and indications are as follows:
- Market Indecision: The Doji represents a period of market indecision. The similar opening and closing prices indicate a balance between buyers and sellers. This state of equilibrium often suggests that the trend could be nearing its end.
- Potential Trend Reversal: When a Doji candlestick appears at the top of an uptrend or the bottom of a downtrend, it can suggest a potential trend reversal. The Doji indicates that the market forces of supply and demand are becoming more evenly matched, potentially leading to a change in the trend direction.
- Confirmation Required: A Doji candlestick by itself does not provide enough information to execute a trade. Traders should wait for confirmation in the following candlesticks. For example, a bearish candlestick following a Doji at the top of an uptrend can be a strong sell signal.
- Volume Analysis: When a Doji candlestick forms with high volume, it implies that a large number of traders are involved in this market indecision. This could potentially make the Doji a more reliable reversal signal.
What does the Doji Candlestick tell traders?
The formation of a Doji candlestick reflects certain activities and sentiment among large institutional traders. Understanding these activities can aid retail traders in making accurate predictions:
- Market Indecision: The appearance of a Doji candlestick signifies a moment of indecision among big traders. Neither buyers nor sellers have managed to gain the upper hand, leading to a stalemate, which is reflected in the nearly identical opening and closing prices.
- Potential Shift in Control: If a Doji forms after a significant uptrend or downtrend, it could imply that large traders are beginning to lose control, and the opposing side is starting to gain strength. This could mark the beginning of a potential trend reversal.
- Position Adjustments: The appearance of a Doji might indicate that big traders are adjusting their positions. For instance, in an uptrend, some big buyers might start selling to take profits, anticipating a possible trend reversal.
- Waiting for Confirmation: Like retail traders, institutional traders also look for confirmation after a Doji. They might await further price action or other technical indicators to validate the Doji’s signal before making significant trading decisions.
Confirmation Tools
here’s a table of four potential confirmation tools that can help validate a Doji candlestick pattern:
| Confirmation Tool | Description |
|---|---|
| Key Levels | A Doji’s significance increases when it forms near important support or resistance levels. It could suggest a strong reaction to these price levels and a potential reversal. |
| Break of High/Low | Following a Doji, a break above the high of the Doji in a downtrend or below the low in an uptrend can confirm a potential trend reversal. |
| High Volume | If a Doji forms with a high trading volume, it could suggest a stronger reversal signal. High volume indicates a higher level of trader participation and possibly a shift in sentiment. |
| Other Technical Indicators | Incorporating other technical indicators such as RSI, MACD, or Stochastic Oscillator can provide additional confirmation. For instance, if the RSI is in overbought territory when a Doji forms at a resistance level, it could strengthen the reversal signal. |
These confirmation tools can enhance the reliability of the Doji pattern
Important Points
Best Timeframe: A Doji can form on any timeframe, but it’s generally more reliable on longer timeframes, such as the 1-hour, 4-hour, or daily charts. These timeframes reduce market noise and provide clearer signals.
Trading Session: The Doji can occur in any trading session. However, patterns that form during sessions with higher liquidity, like the London and New York session overlap in Forex trading, can often provide stronger signals due to increased trading volume.
Winning Ratio: The winning ratio of trades based on the Doji pattern can vary significantly based on several factors, including market conditions, the trader’s skill level, and the use of additional confirming indicators. However, when properly used in conjunction with other forms of analysis, the Doji pattern can potentially have a winning ratio ranging from 50% to 70%.
Trading Strategy with Support Zone Confluence
- Identifying the Pattern and Confluence Zone: Look for a Doji candlestick pattern forming near a known support level in a downtrend or resistance level in an uptrend. The confluence of these factors can significantly increase the potential for a successful trade.
- Entry Point: Once you identify the Doji candlestick at a key level, wait for a confirmation candle that indicates a reversal. In a downtrend, the confirmation candle would be bullish, signaling an entry point for a long trade. In an uptrend, the confirmation candle would be bearish, indicating an entry point for a short trade.
- Stop Loss: Set your stop loss slightly below the low of the Doji and support level for a long trade, and slightly above the high of the Doji and resistance level for a short trade. This ensures you limit your losses if the price moves against your prediction.
- Take Profit: The take profit level can be set at the next significant resistance level for a long trade, or support level for a short trade. Alternatively, you could use a fixed risk/reward ratio, like 1:2 or 1:3, to set your take profit level.
Conclusion
The Doji candlestick pattern is a powerful tool in a trader’s arsenal, signaling potential market reversals. When used in combination with key support and resistance levels, it can lead to high-probability trades. As always, ensure proper risk management practices are in place, as the Doji, like any technical tool, does not guarantee 100% successful trades.

