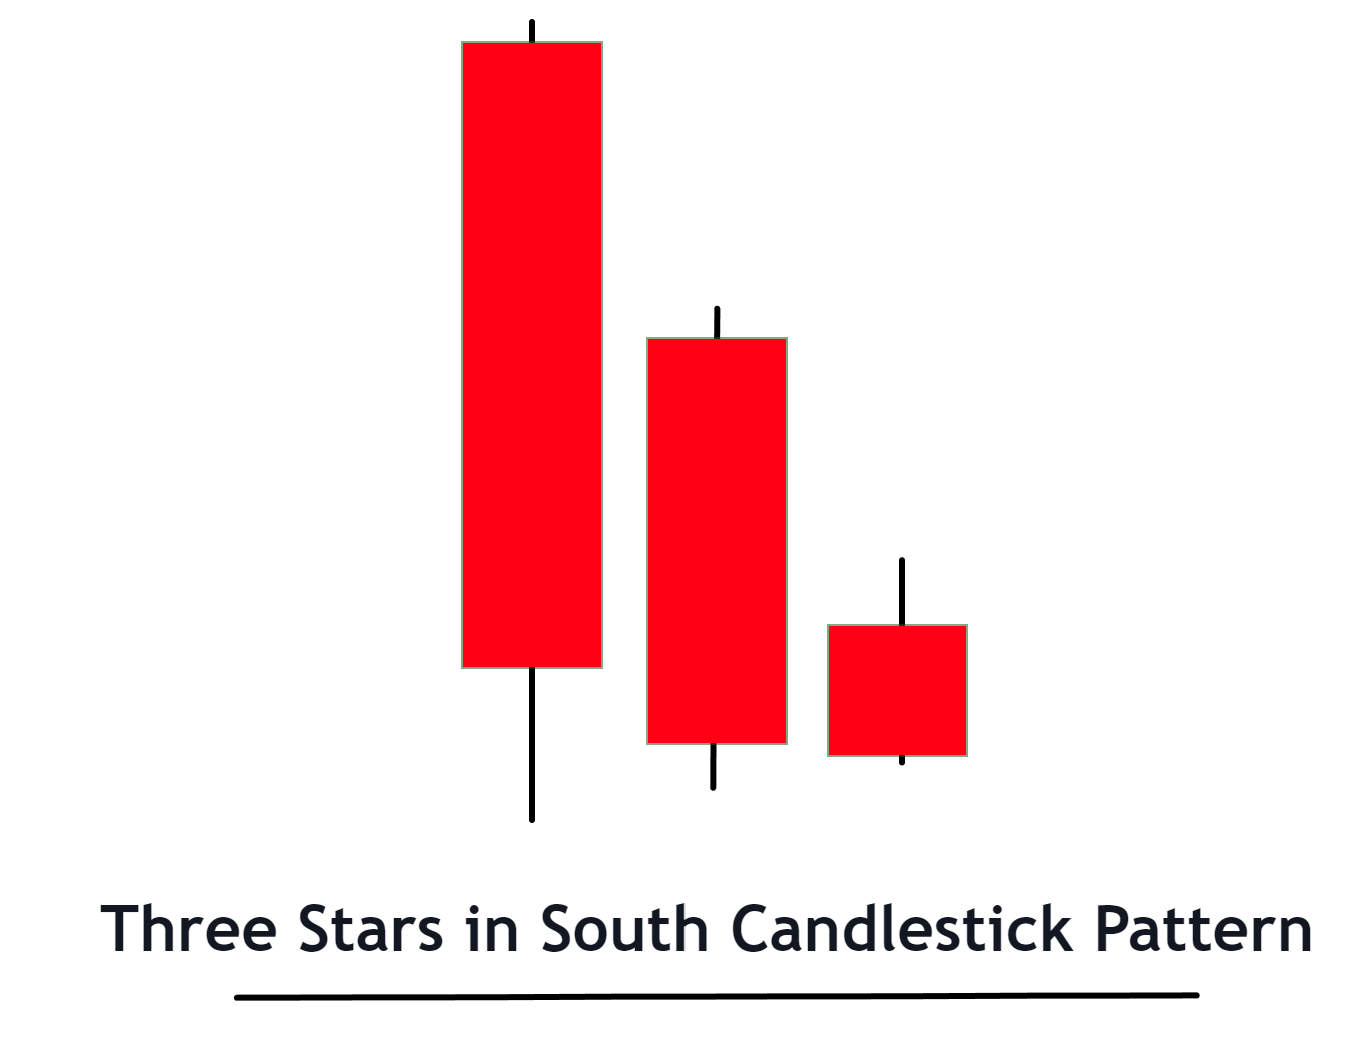
The Three Stars in the South is a bullish candlestick pattern consisting of three candles, starting with a long black candlestick followed by two smaller black candlesticks, each with a lower low than the previous day, indicating potential price reversal upwards.
This pattern serves as an anticipatory sign of a shift from a bearish to a bullish market, thus offering traders an opportunity to capitalize on the impending upswing.
How to identify the Three Stars in the South Candlestick Pattern?
To identify the Three Stars in the South candlestick pattern on a chart, you should follow these steps:
- First Black Candle: Look for a large black (or red) candle that occurs within a downtrend. This candle reflects a strong bearish sentiment.
- Second Black Candle: The next day should also see a smaller black (or red) candle, but it should close within the previous day’s range. This candle typically opens within the range of the first day’s candle.
- Third Black Candle: The third day will again have a black (or red) candle which is smaller than the second day’s candle. It again closes within the range of the previous day’s candle. This candle typically opens within the range of the second day’s candle.
- Smaller Size: The successive candles should be smaller, indicating slowing momentum for the bears.
- Candle Positioning: The three candles should fall towards the lower end of the recent price range or near a support level.
Significance
The Three Stars in the South candlestick pattern is a powerful tool that can provide valuable insights into market dynamics for a professional trader. Here are its primary significances and indications:
- Trend Reversal Indicator: The Three Stars in the South is primarily a bullish reversal pattern. If you spot this pattern during a prolonged downtrend, it could signal that the bears are losing control and a bullish reversal is imminent.
- Lowering Selling Pressure: The progressively smaller black candles and their lower lows indicate that the selling pressure is diminishing. This could suggest that bears are exhausting their selling momentum, paving the way for bulls to take over.
- Potential Buy Signal: If this pattern is identified, especially around key support levels or after a long downtrend, it could serve as a potential buy signal. Traders might consider initiating a long position in anticipation of the bullish reversal.
- Confirmation Required: Like all candlestick patterns, the Three Stars in the South needs to be confirmed by a subsequent bullish candle or other bullish indicators to substantiate the reversal signal.
Activity of market makers behind the formation of this candlestick pattern
When the Three Stars in the South candlestick pattern forms, it suggests that a change in the market sentiment is in progress. Here’s what’s potentially happening with big traders or institutions:
- Exhausting Selling Activity: The initial large black candle in the pattern typically represents a strong selling activity by big traders or institutions, driving the price lower. However, the successive smaller candles indicate that this selling activity is gradually tapering off. The bears are losing momentum, possibly because of exhausted sellers or increased demand at lower price levels.
- Accumulation Phase: The fact that each candle closes within the range of the previous one might indicate that institutions or large traders are beginning to accumulate the asset. The lower prices presented by the downtrend and the diminishing selling pressure make the asset increasingly attractive for buying.
- Reversal Preparation: The formation of the Three Stars in the South could also suggest that big traders are preparing for a price reversal. They might be closing their short positions and opening long ones, in anticipation of the price going up.
- Confirmation Wait: Big traders usually wait for confirmation after the formation of the pattern. They look for a bullish candle or other positive technical indicators as signs of the anticipated uptrend. Once confirmation is received, a surge in buying activity from these traders can further fuel the bullish reversal.
Confirmation tools
| Confirmation Tool | Description |
|---|---|
| Key Support Level | The Three Stars in the South pattern is more reliable if it forms near a known support level. This could be a historical price level where the asset has bounced back in the past, indicating a strong buying interest. |
| Break of High | After the formation of the pattern, a break above the high of the three candles can serve as a confirmation of a bullish reversal. This suggests the bulls have taken control from the bears. |
| Increasing Volume | A significant increase in volume during or immediately after the pattern can confirm a bullish reversal. This indicates that the buying pressure is strong, and the asset is in demand. |
| Bullish Technical Indicators | The use of other technical indicators, such as moving averages, RSI, or MACD, turning bullish can offer additional confirmation. For instance, an RSI moving above 30 from an oversold condition or a bullish MACD crossover can be a good sign. |
Each tool provides an additional layer of confirmation, increasing the chances that the pattern will result in a price reversal.
Key Points
Best Timeframe: The Three Stars in the South pattern can appear on any timeframe, but it’s generally considered more reliable on longer timeframes such as the daily (D1) or weekly (W1) charts. Longer timeframes tend to filter out market ‘noise’ and provide clearer signals.
Trading Session: This pattern can be traded in any session. However, it is important to consider the market’s liquidity and volatility during the trading session. For Forex traders, the overlap of London and New York sessions usually provides high liquidity and can offer reliable signals.
Winning Ratio: The winning ratio for the Three Stars in the South pattern varies and depends on the trader’s skill, risk management, and market conditions. However, with proper confirmation and optimal market conditions, it’s estimated to be successful around 60-65% of the time.
Trading strategy with confluence of support zone
- Identifying the Pattern: Look for the Three Stars in the South pattern forming near a known support level. The proximity to the support level increases the validity of the pattern.
- Entry: Once the pattern is formed and a subsequent bullish candle appears, consider this as a potential buy signal. The entry point could be the open of the next candle after the bullish confirmation.
- Stop Loss: Set the stop loss below the lowest low of the pattern. This placement ensures you limit your losses if the price moves against the expected direction.
- Take Profit: The take profit level could be set at the next significant resistance level or based on a risk/reward ratio. For instance, if you’re risking $1 per share (the difference between entry price and stop loss), aim for at least $2 per share in profit.
Conclusion
The Three Stars in the South is a bullish reversal candlestick pattern that indicates the potential end of a downtrend and the start of an uptrend. It’s particularly effective when used in conjunction with other technical analysis tools like support levels and volume indicators. It’s essential to wait for bullish confirmation after the pattern and to always practice solid risk management.

