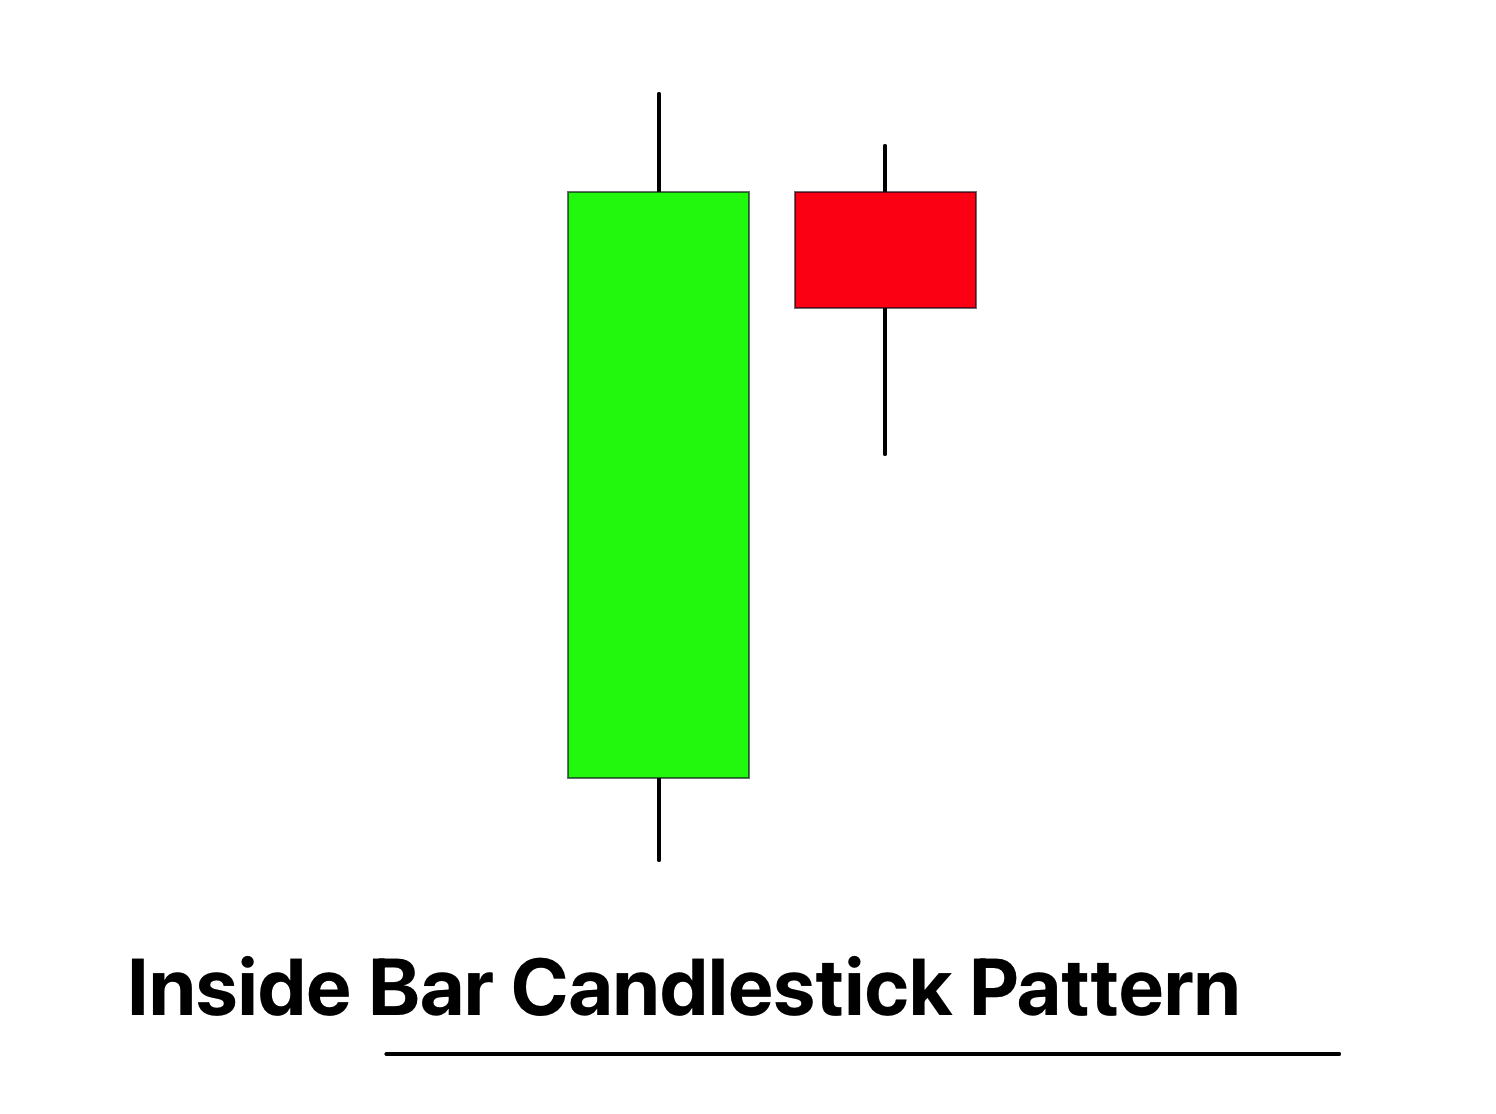
An Inside Bar is a two-candlestick pattern in which the range of the second candle (high to low) is completely encompassed by the range of the previous candle.
This pattern is often interpreted as a period of consolidation before the price continues in the direction of the overall trend, or a potential reversal signal. Its simplicity and effectiveness make it a commonly used pattern in various trading strategies across different timeframes and asset classes.
How to identify the inside bar candlestick pattern?
To find the inside bar pattern on the candlestick chart, follow the following points:
- Prior Trend: While the Inside Bar can occur in both uptrends and downtrends, it often carries more significance if it forms during a clear, consistent trend.
- First Candle (Mother Bar): Look for a candle that has a relatively large range compared to the candles around it. This is often referred to as the “mother bar”.
- Second Candle (Inside Bar): The next candle is the Inside Bar. Its entire price range (from the high to the low) must fall within the range of the mother bar. This includes both the body and the wicks of the candle.
- Number of Inside Bars: There can be one or more Inside Bars within the range of the mother bar. When multiple Inside Bars occur in a row, it can signal even stronger consolidation.
Significance and indications
The Inside Bar pattern is a commonly used tool among professional traders due to its ability to provide significant indications about potential market movements:
- Indecision or Consolidation: The primary interpretation of an Inside Bar is that it represents a period of indecision or consolidation in the market. During the formation of an Inside Bar, neither the buyers nor the sellers are able to gain control, and the price ends up trading within the range of the previous bar. This often happens after a strong price move, as the market takes a breather before deciding on the next direction.
- Continuation or Reversal Signal: The Inside Bar can act as a continuation signal or a reversal signal depending on the context. If it forms during a clear trend, it’s often seen as a sign that the trend will continue after a brief pause. However, if it forms at key support or resistance levels, it could signal a potential price reversal.
- Lower Risk Entry Points: The Inside Bar can provide traders with potential low-risk entry points, as trades can be entered with a stop loss just outside the range of the mother bar. This gives a clear, predefined level at which the trader knows their analysis was incorrect.
- Versatility: The Inside Bar pattern can be used on various timeframes and across different markets, making it a versatile tool for traders.
Activity of traders in the market during inside bar candlestick formation
When an Inside Bar forms, it often signifies a temporary equilibrium between buyers and sellers, which can offer key insights into the activities of larger, institutional traders:
- Consolidation Phase: An Inside Bar usually represents a consolidation phase. During this phase, big traders are evaluating their positions. They might be booking profits after a strong price move, or re-evaluating the market conditions before placing further trades. This profit-taking or lack of further trading leads to lower volatility, creating the Inside Bar.
- Anticipation of Future Moves: Inside Bars often form before significant news events or economic releases. Large traders may reduce their market activity to wait for these events, leading to a tightening price range.
- Accumulation or Distribution: Inside Bars can indicate phases of accumulation (in an uptrend) or distribution (in a downtrend), where big traders are gradually building or unwinding their positions. This subdued activity doesn’t significantly move the price, creating the Inside Bar pattern.
- Potential Setup for Breakouts: Big traders often use Inside Bars as low-risk points for placing new trades, contributing to the breakout that often follows the Inside Bar pattern. When the price breaks the range of the mother bar, it can trigger stop orders placed by these traders, leading to a sharp price move.
Confirmation tools for inside bar
here are four tools that can be used to confirm the high probability Inside Bar pattern:
| Confirmation Factor | Description |
|---|---|
| Key Level | The Inside Bar pattern gains significance if it forms at a key level of support or resistance. If it forms at resistance in an uptrend, or support in a downtrend, it could indicate a potential reversal. Conversely, if it forms at support in an uptrend, or resistance in a downtrend, it could signal a continuation. |
| Break of Mother Bar’s High/Low | A common confirmation signal is the price breaking above the high of the mother bar in a bullish scenario, or below the low of the mother bar in a bearish scenario. This could suggest a continuation of the trend. |
| High Trading Volume | A spike in volume on the breakout of the Inside Bar’s range can serve as a powerful confirmation signal. High volume on the breakout suggests strong participation and potentially more significant price moves. |
| Oversold/Overbought RSI | The Relative Strength Index (RSI) can be a useful tool to confirm the Inside Bar. If the pattern forms when the RSI is in an overbought region in an uptrend (or oversold region in a downtrend), it could increase the reliability of the potential reversal signal. |
These factors can enhance the effectiveness of the Inside Bar pattern.
Key points to remember in trading with inside bar
Best Timeframe: The Inside Bar can be traded on various timeframes, but it often provides more reliable signals on higher timeframes such as the 4-hour, daily, or weekly charts. These higher timeframes tend to filter out a lot of the ‘noise’ associated with lower timeframes and provide a clearer view of the market.
Trading Session: The effectiveness of the Inside Bar isn’t limited to a particular trading session. It can be used during any session, including the New York, London, or Asian sessions. However, keep in mind that the volatility and trading volume can vary across different sessions, which could impact the performance of this pattern.
Winning Ratio: The winning ratio of the Inside Bar pattern varies and can greatly depend on the specific trading strategy, risk management techniques, and market conditions. As a rough estimate, a well-executed Inside Bar strategy could potentially yield a winning ratio of around 50-60%, but this is by no means guaranteed and can be higher or lower depending on the factors mentioned above.
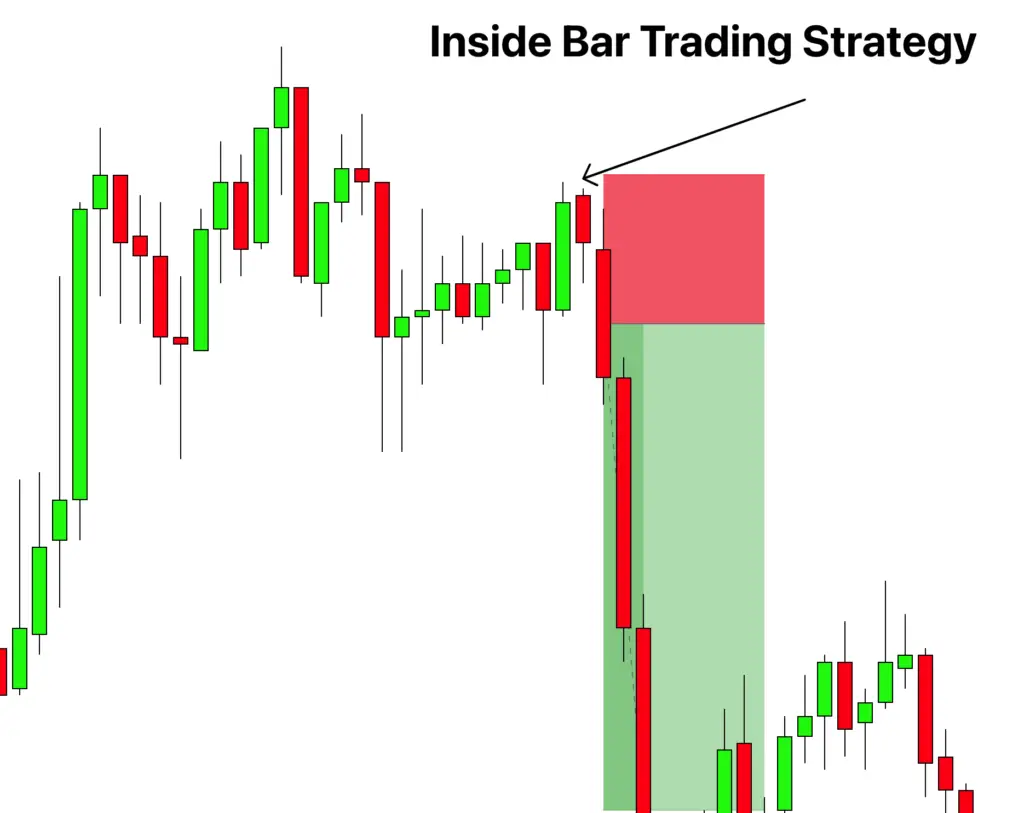
Inside bar trading strategy
Here I will explain a simple strategy using the confluence of resistance zone.
here’s how you might trade an Inside Bar pattern using a resistance zone as a confluence factor, explained in a professional manner:
- Identify the Inside Bar at a Resistance Zone: Look for an Inside Bar pattern that has formed at a key resistance level. The resistance could be a horizontal level, a trendline, a moving average, or a Fibonacci retracement level.
- Wait for Confirmation: To increase the probability of a successful trade, wait for additional confirmation. This could be a breakout of the Inside Bar pattern on higher volume, or other technical indicators showing overbought conditions.
- Entry Point: A typical entry point for a short trade would be just below the low of the mother bar, suggesting that the sellers have taken control of the market.
- Stop Loss: Place your stop loss just above the high of the mother bar. This way, if the market reverses and moves against your trade, you’ll be taken out of the position with a minimal loss.
- Take Profit: Set your initial take profit target equal to the distance from the entry point to the stop loss (i.e., the height of the mother bar). This will give you a 1:1 risk-to-reward ratio. However, depending on the market conditions and your trading strategy, you may choose to set a more ambitious target or to scale out of your position in increments.
Always remember, successful trading is not just about strategy execution but also includes efficient risk management and maintaining a disciplined trading psychology. Each trader should adjust this strategy according to their trading style and risk tolerance, and thoroughly backtest it before live trading.
Conclusion
In conclusion, the Inside Bar pattern is a powerful yet straightforward tool in a trader’s arsenal. It signifies a moment of market consolidation and can provide valuable insights about potential future price direction. Whether used as a continuation or reversal signal, it allows traders to formulate strategies with well-defined risk and reward parameters.
However, it should not be used in isolation like any trading tool. Combining the Inside Bar pattern with key support or resistance levels, observing volume patterns, and using additional technical indicators can significantly increase its effectiveness.
Most importantly, successful trading involves much more than recognizing a single pattern. Consistent risk management, emotional discipline, and a well-constructed trading plan are essential for long-term success in the financial markets.

