Definition
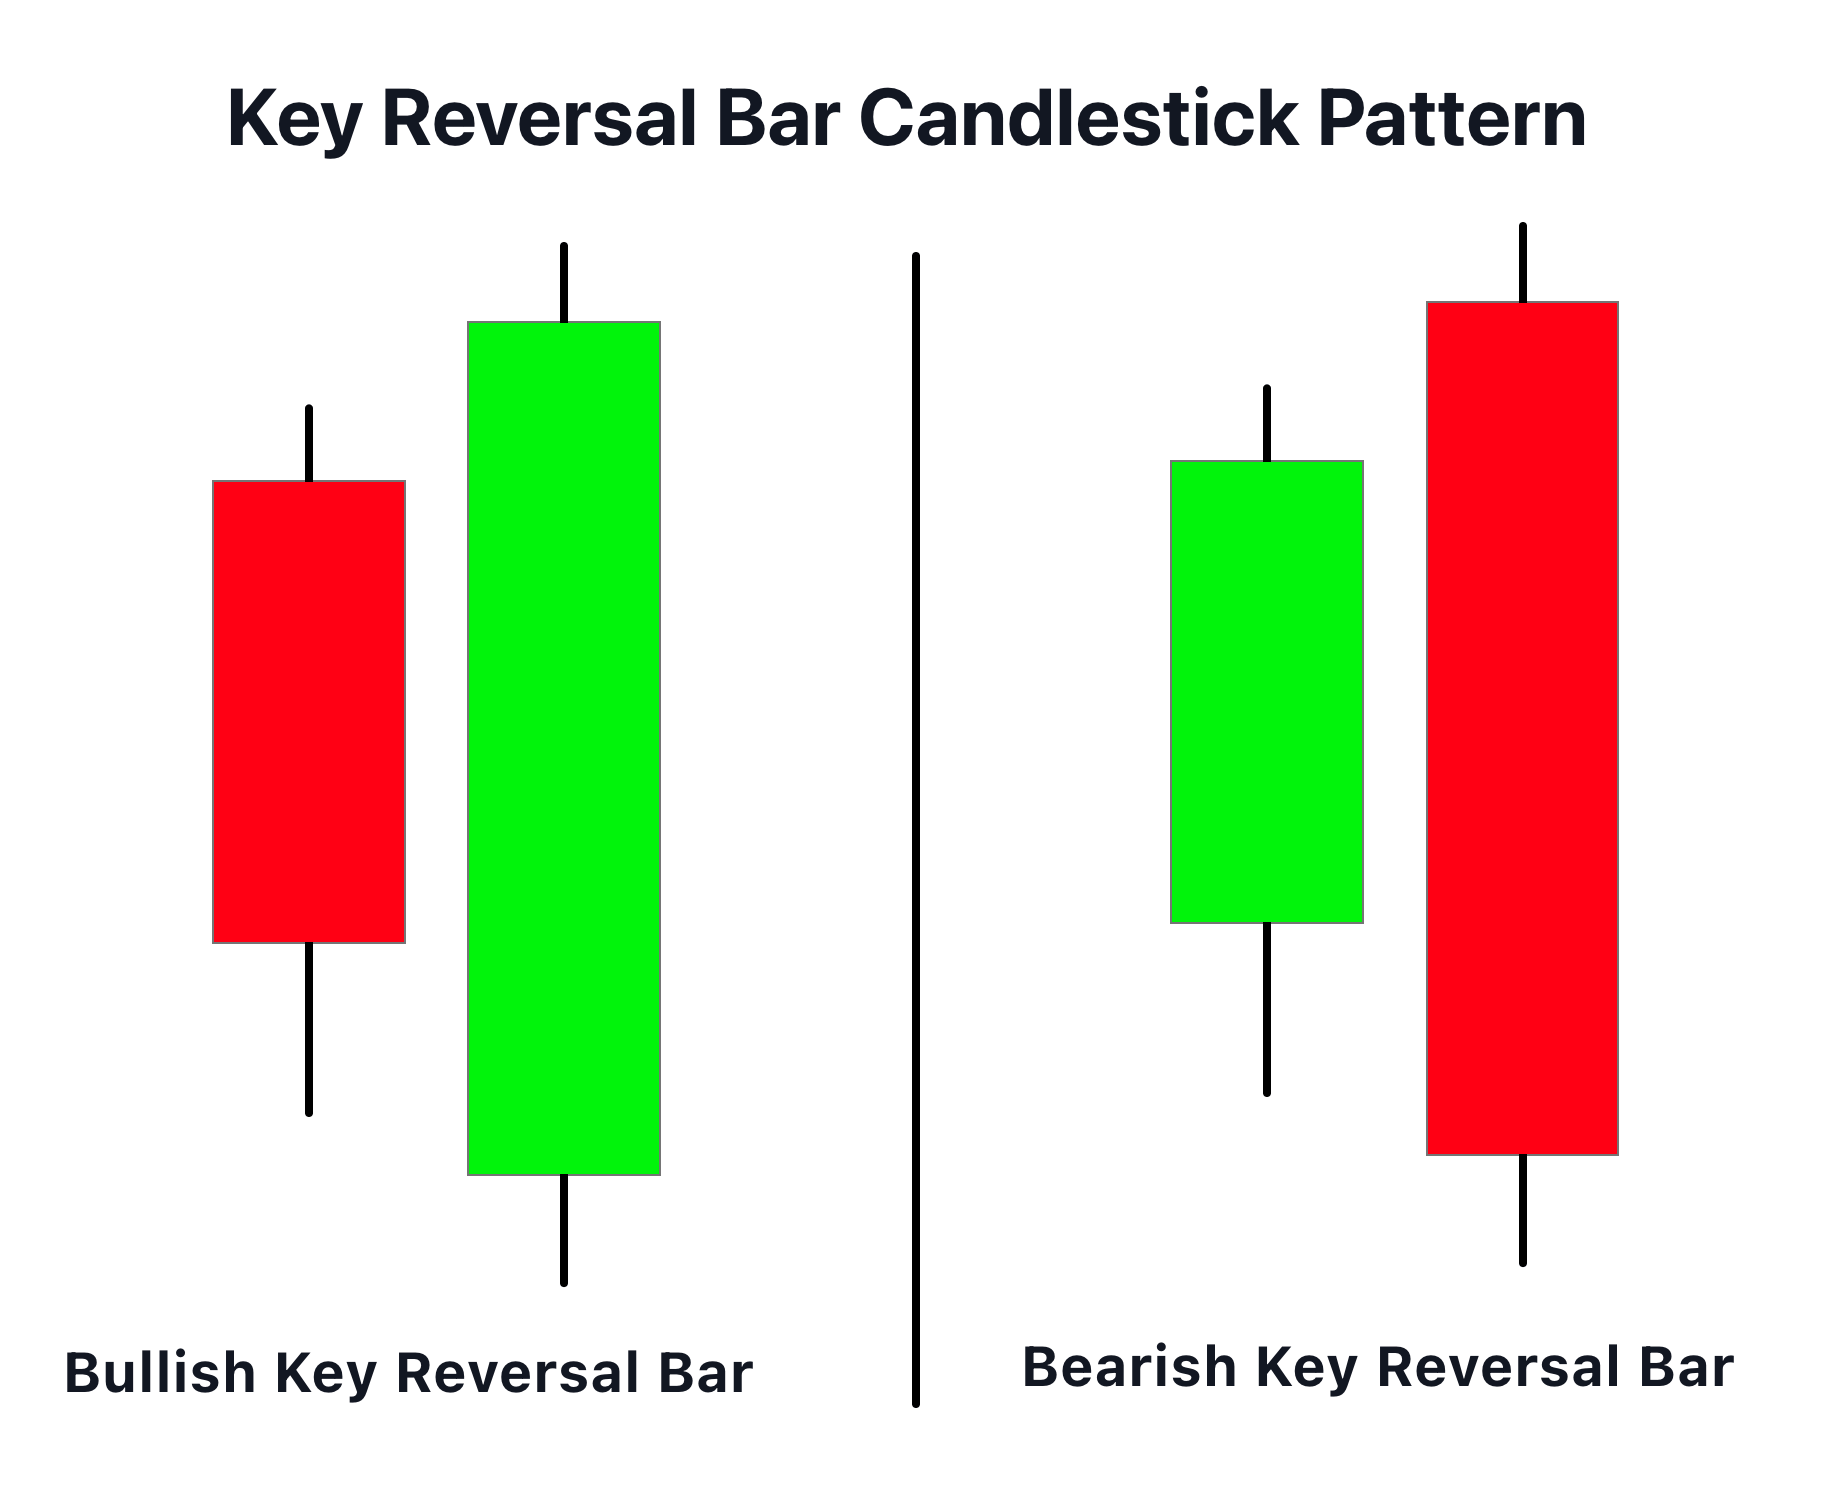
A Key Reversal Bar is a single candlestick pattern that signals a potential reversal in the prevailing trend; it opens below the previous bar’s low in an uptrend, or above the prior bar’s high in a downtrend, and closes beyond the opposite end of the previous bar.
The Key Reversal Bar provides valuable insights into potential shifts in market sentiment, thereby paving the way for trend reversals.
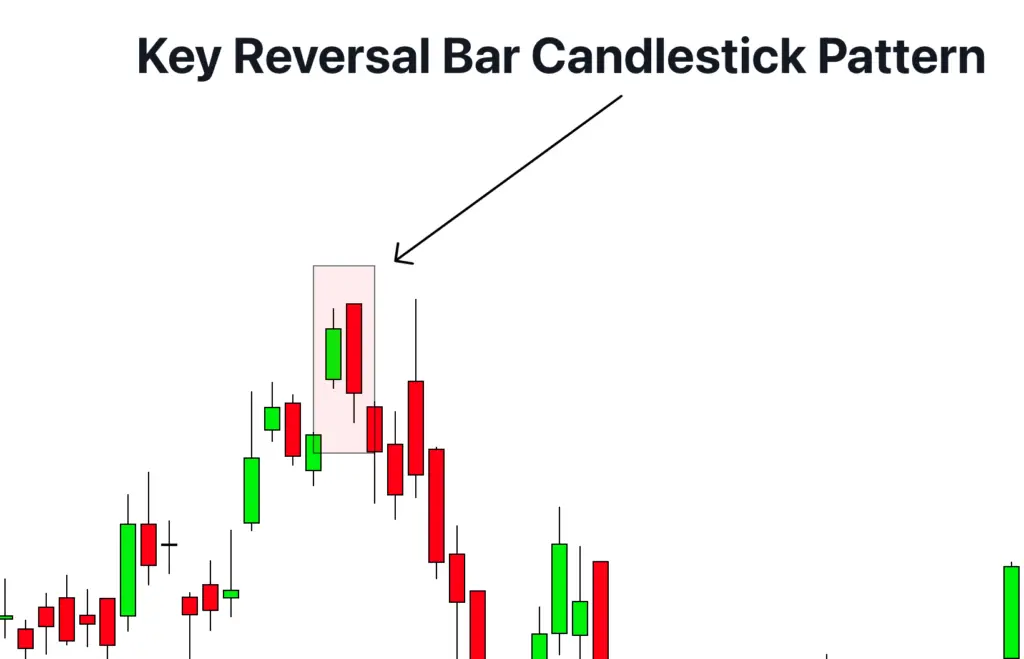
How to identify the Key Reversal Bar Pattern?
To identify a Key Reversal Bar pattern on the chart, follow these steps:
- Prevailing Trend: Initially, there should be a clear existing trend in place. An uptrend for a bearish Key Reversal Bar or a downtrend for a bullish Key Reversal Bar.
- Open Price: In an uptrend, the Key Reversal Bar’s opening price should be lower than the previous bar’s low. In a downtrend, it should open above the prior bar’s high.
- Closing Price: The closing price of the Key Reversal Bar should be higher than the previous bar’s high in a downtrend (signalling a potential reversal to the upside). In an uptrend, the closing price should be lower than the previous bar’s low, implying a potential downtrend reversal.
- Bar Size: The Key Reversal Bar should ideally be larger than the average bar size to indicate a strong reversal signal. This greater size reflects the intensity of the market’s change in sentiment.
Significance
A Key Reversal Bar is a significant candlestick pattern as it potentially indicates a strong reversal in market sentiment. It shows a heightened level of commitment from traders and investors in the opposite direction to the prevailing trend. For instance, during an uptrend, a bearish Key Reversal Bar signals that the bulls have lost control and the bears have taken over, implying a possible downward trend.
For a bullish Key Reversal Bar in a downtrend, it indicates that selling pressure is exhausted and buyers have taken control, which may lead to a new uptrend. Hence, this pattern can provide critical insights into possible market turning points.
However, as with any single candlestick pattern, the Key Reversal Bar should not be used in isolation. It is best used in conjunction with other technical analysis tools or indicators for confirmation of a trend change. Traders can look for additional signs of a reversal such as higher trading volume during the formation of the pattern, divergence with momentum indicators, or the breakout of significant price levels.
The efficacy of the Key Reversal Bar also often depends on its context within a broader chart pattern or trend. For instance, a Key Reversal Bar at the end of a well-established trend or at a significant support or resistance level is often more reliable.
Activity of Traders behind the Key reversal bar pattern
When a Key Reversal Bar forms, it suggests substantial activity by larger traders or institutions shifting their positions, and hence the market sentiment. The pattern is a result of significant volume, which often only large traders can generate.
In the case of a bullish Key Reversal Bar, it indicates that despite the initial selling pressure continuing the bearish trend, big buyers have stepped in, absorbed the sell orders and subsequently pushed prices higher to close above the open of the previous bar. This shows a strong shift in control from sellers to buyers, suggesting the possibility of an upcoming bullish trend.
Conversely, a bearish Key Reversal Bar forming in an uptrend implies large sellers have taken control. The bar opens higher than the previous close, but selling pressure overpowers the buyers, pushing the price below the prior bar’s open. This shift suggests larger market participants are starting to take profits or establish short positions, signalling a potential downtrend.
How to increase the winning ratio of the Key Reversal Bar Candlestick?
A trader can increase the winning ratio of candlestick pattern by addition of technical confluences.
| Confirmation Tool | Description |
|---|---|
| Key Levels | Key levels like support and resistance, pivot points, and Fibonacci levels can provide a context where a Key Reversal Bar could potentially form. The pattern forming at these levels indicates that the level is being respected, and a reversal is more likely. |
| Volume | An increased volume on the Key Reversal Bar adds to the reliability of the reversal signal. It shows that the shift in market sentiment is supported by a large number of participants. |
| Trend Lines/Breakouts | If the Key Reversal Bar forms on a major trend line or channel boundary, it adds to the pattern’s credibility. A breakout from a long-lasting trend or range confirmed by a Key Reversal Bar is a strong reversal sign. |
| Technical Indicators | Indicators like RSI, Stochastic oscillator can help identify overbought or oversold conditions. A Key Reversal Bar forming in these extreme conditions can signal a high probability reversal. Oscillators divergence with price can also be a confirmation of the reversal. |
Note: Confirmation from at least two or three of these tools could significantly increase the success rate of the signals provided by the Key Reversal Bar pattern.
Key Points to remember
Best Timeframe: The Key Reversal Bar pattern is versatile and can be found across multiple timeframes. However, its effectiveness increases on higher timeframes, such as the 4-hour, daily, and weekly charts, as they filter out market noise and provide more reliable signals.
Trading Session: The pattern can appear in any trading session, but the most significant results are typically seen during the sessions with the highest liquidity, namely the London and New York sessions. These sessions are more likely to provide the volatility required for the pattern to play out effectively.
Winning Ratio: The winning ratio can vary based on several factors such as the market conditions and the trader’s skill in identifying and trading the pattern. However, with proper risk management and trading discipline, a winning ratio of around 60-70% can be achieved.
Trading Strategy
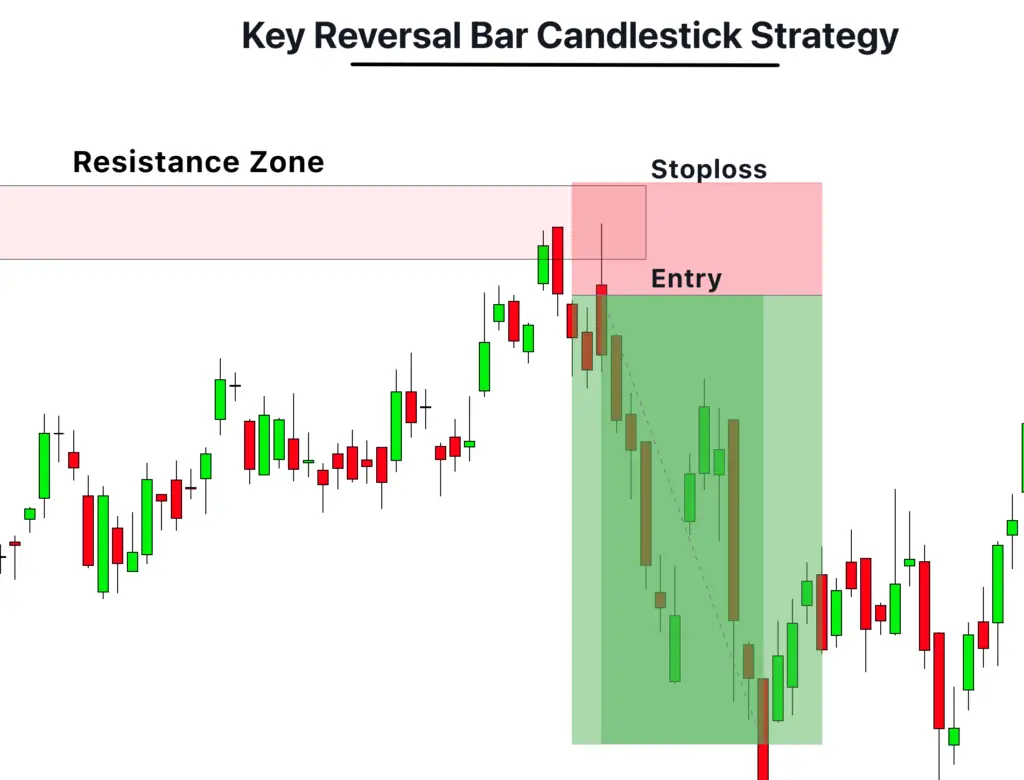
- Entry: First, identify the key reversal bar at a significant level such as support or resistance, pivot points, or Fibonacci levels, this forms a confluence which increases the reliability of the pattern. Your entry should be placed at the open of the next candle after the key reversal bar.
- Stop Loss: Set the stop loss a few pips below the low (for bullish setups) or above the high (for bearish setups) of the key reversal bar. This is to protect the trade if the market moves in the opposite direction.
- Take Profit: The take profit level can be set at a risk-to-reward ratio of 1:2 or 1:3, or at the next significant level of support (for bullish trades) or resistance (for bearish trades).
Conclusion
The Key Reversal Bar candlestick pattern is a potent tool for identifying trend reversals. However, as with any trading system, it’s essential to incorporate other forms of analysis (like checking for confluences, using additional indicators) for more robust trade confirmation and risk management. Using this pattern with discipline and consistency can offer valuable insights into potential market turning points and profitable trading opportunities.

