Definition
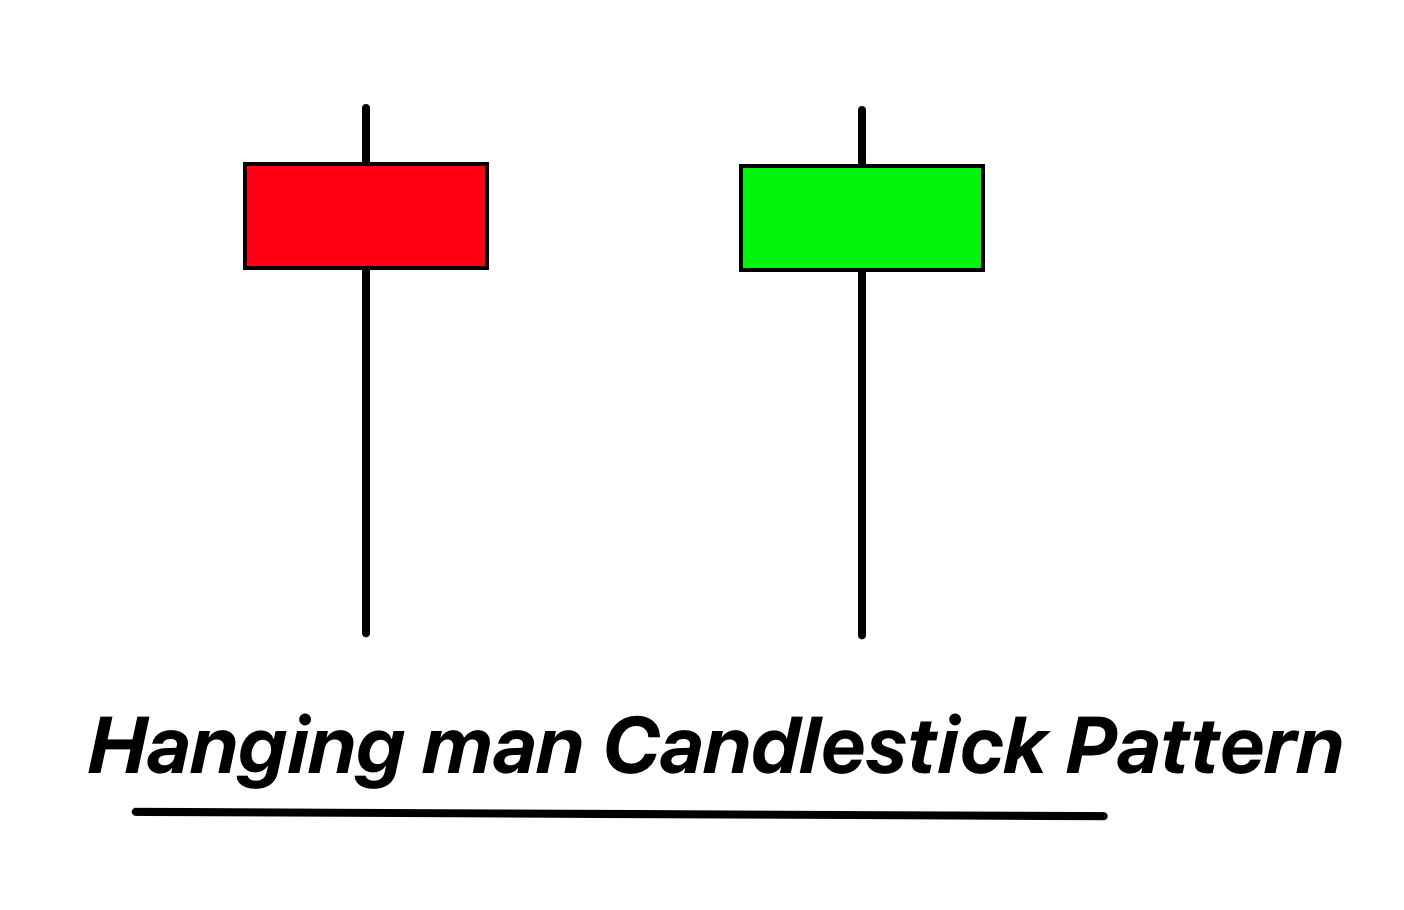
The Hanging Man candlestick pattern is a bearish reversal pattern featuring a small body, little or no upper wick, and a long lower wick at least twice the length of the body, appearing to hang from the top of a price swing.
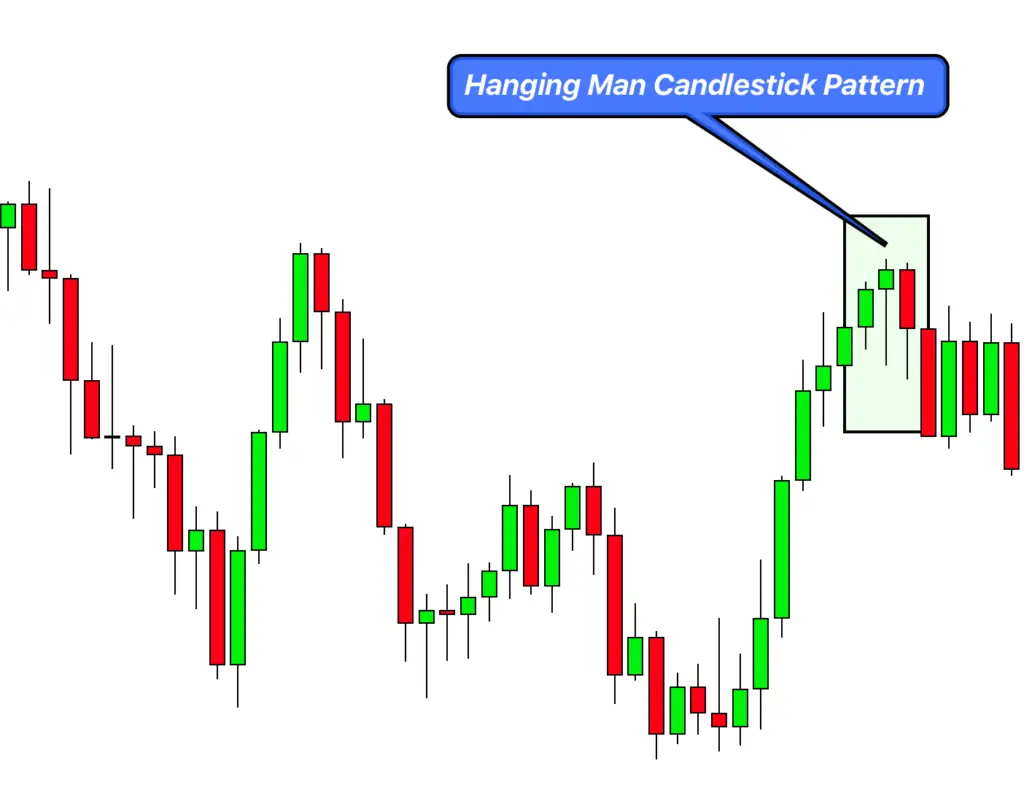
The Hanging Man pattern, found at the end of an uptrend, implies that selling pressure is starting to increase, indicating that the buyers may be losing control and a trend reversal to the downside could be imminent.
Identifying the Hanging Man Candlestick Pattern on a Chart
Here are the steps to identify a Hanging Man pattern on a chart:
- Prior Trend: The pattern should appear after an uptrend, signaling a potential bearish reversal.
- Candlestick Shape: The Hanging Man pattern has a small body, little or no upper wick, and a long lower wick. The lower wick should be at least twice as long as the body.
- Color of the Body: The body can be either green (bullish) or red (bearish). A red Hanging Man is typically considered a stronger bearish signal, but both can potentially indicate a trend reversal.
- Position on the Chart: This pattern should appear at the top of an uptrend. This positioning signals a change in market sentiment, with sellers starting to take control.
- Confirmation: Look for further bearish confirmation in the next candlestick, which should ideally close below the low of the Hanging Man.
These points should help traders to identify the Hanging Man pattern.
Significance and Indications
The Hanging Man pattern holds considerable significance in the trading world due to its potential to signal a bearish reversal. Here are some of its key indications:
- Bearish Reversal: The Hanging Man is primarily a bearish reversal pattern. It indicates that despite buyers’ attempts to push the market higher, sellers have managed to pull it back down, suggesting a loss of momentum from the buyers.
- Market Sentiment Shift: The long lower wick represents a period during which sellers managed to push the price significantly lower, despite the price closing near the open. This can indicate a shift in market sentiment, signaling that bears may be gaining strength.
- Confirmation Required: It’s crucial to wait for confirmation before making a trading decision based on a Hanging Man pattern. This confirmation could come in the form of a gap down or a bearish candlestick on the following period.
- Increased Significance with Volume: A Hanging Man candlestick that is accompanied by high volume typically carries more weight as it suggests that the bearish reversal has been agreed upon by a larger market population.
Market Activity of Large Traders during the Formation of the Hanging Man Pattern
Understanding the behavior of large institutional traders when a Hanging Man pattern forms can provide valuable insights for retail traders. Here’s how big traders might react:
- Selling Pressure: The long lower shadow of the Hanging Man represents a period where big traders aggressively sold off, driving the price significantly lower. If the price then rebounds to close near the opening level, this shows that the buyers were able to fight back but suggests increasing selling pressure.
- Profit Taking: If a Hanging Man forms at the top of an uptrend, it may indicate that large traders are starting to take profits, leading to selling pressure which may signal the start of a bearish reversal.
- Wait for Confirmation: Many institutional traders will wait for additional confirmation following a Hanging Man pattern before making significant moves. This could be in the form of a bearish candlestick or gap down in the following trading period.
- High Volume: The presence of high trading volume during the formation of a Hanging Man can signify substantial participation by big traders, making the potential reversal more significant.
Understanding these potential behaviors of large traders can help retail traders make more informed decisions.
Confirmation Tools for the Hanging Man Candlestick Pattern
Below is a table of four key confirmation tools that can strengthen the reliability of a Hanging Man pattern:
| Confirmation Tool | Description |
|---|---|
| Key Resistance Levels | The Hanging Man’s significance increases when it forms near significant resistance levels. This suggests that the market may have hit a price ceiling, supporting a potential reversal. |
| Bearish Confirmation Candle | A bearish candle following a Hanging Man can confirm the reversal signal. Ideally, this candle should close below the Hanging Man’s low. |
| High Volume | High trading volume during or after the Hanging Man formation indicates a stronger reversal signal. It shows that the price rejection involved significant market participants. |
| Other Technical Indicators | Other technical indicators such as RSI, Stochastics, or MACD can provide additional confirmation. For example, if RSI is overbought when a Hanging Man forms at a key resistance level, it could strengthen the bearish reversal signal. |
These confirmation tools should be used as part of an overarching trading strategy, and always in conjunction with solid risk management protocols.
Key Parameters
Best Timeframe: The Hanging Man pattern can be observed on any timeframe, but its reliability is enhanced on higher timeframes like the 1-hour, 4-hour, or daily charts. These longer timeframes help filter out market noise and increase the pattern’s validity.
Trading Session: The pattern can form in any trading session. However, patterns that occur during high liquidity sessions such as the London and New York overlap (for Forex markets) may offer more reliable signals due to increased market volatility and volume.
Winning Ratio: The Hanging Man, as with any candlestick pattern, has varying success rates based on the market conditions and the trading strategy used. In conjunction with proper confirmation tools and in the right context, this pattern can offer a winning ratio anywhere between 50-70%.
Trading Strategy with the Hanging Man Pattern and Confluence Factors
Trading with the Hanging Man pattern involves looking for bearish reversal signals at the top of an uptrend. Here’s a simple trading strategy incorporating confluence factors:
- Find the Hanging Man: First, identify a Hanging Man pattern that has formed at the top of an uptrend on your chosen timeframe.
- Confluence Check: Check for confluence factors such as key resistance levels, overbought conditions from RSI or Stochastic Oscillator, or a bearish divergence with the price.
- Entry Point: A suitable entry point for a short trade could be the closing of a bearish candlestick following the Hanging Man, particularly if it closes below the low of the Hanging Man.
- Stop Loss: Place the stop loss slightly above the high of the Hanging Man pattern, ensuring to account for the market volatility.
- Take Profit: A conservative take profit level could be at the next significant support level. However, if the trend reversal is strong, more aggressive profit targets can be set at further support levels.
Conclusion
The Hanging Man is a valuable tool in a trader’s arsenal, signaling potential bearish reversals in the market. Its power lies not only in its standalone implications but also when used in conjunction with other technical indicators or significant price levels. The reliability of this pattern increases with the presence of confluence factors and when it’s used as part of a comprehensive trading strategy.

