
Breakout and stop zone is a price patterns made by institutional traders in the form of double or triple bottom/top patterns to trap retail traders. It is denoted by BSZ. BSZ means Breakout and stop zone.
Big traders and market makers always trap retail traders because they run the market. The only way to survive in this industry is by learning the way of big institutions.
In this article, I have explained the Breakout and stop zone strategy that market makers use to trap small traders. This is also a stop-loss hunting tool in trading.
How does the BSZ pattern form?
Retail traders are taught to learn trading simple support and resistance in technical analysis. I’m not saying here that support and resistance do not work. It works, but the institutions trap retail traders in the methods of support resistance trading.
Let me explain to you with an example
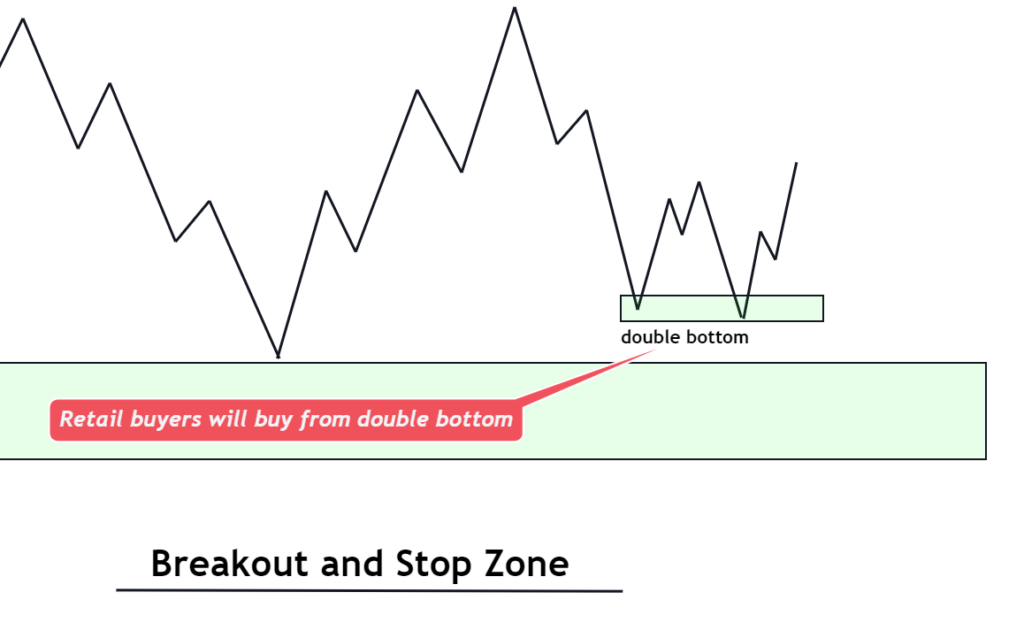
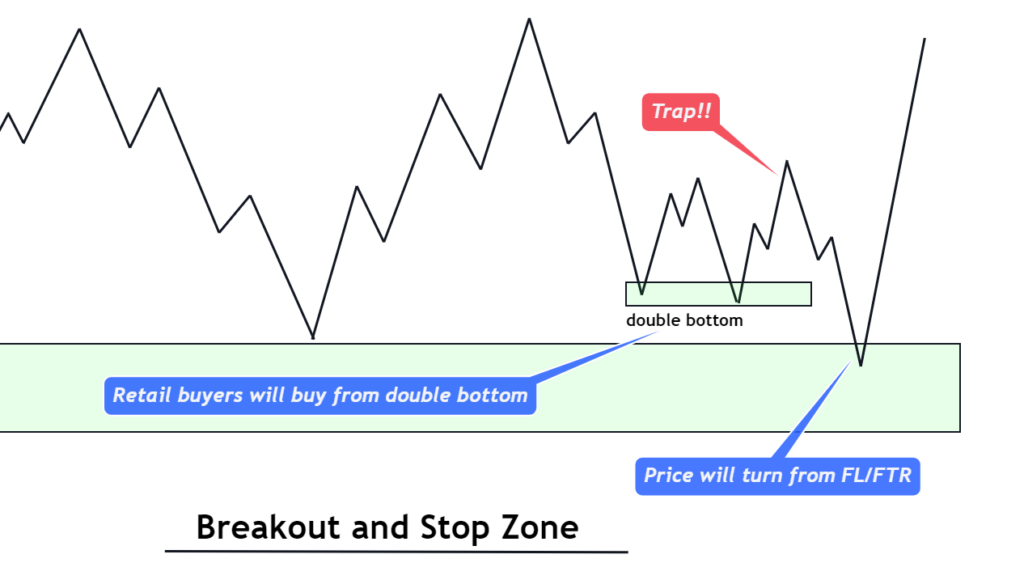
After two price bottoms, a support zone forms. Retail traders try to buy from the support zone on the third touch. While if the price breaks the support zone, retail traders will open sell trades. Here big institutions will play a game. They plot a double-bottom or triple-bottom pattern at the third touch. Due to this, buyers will buy, and institutions will continue to move downward until they break the support zone.
Now buyers will close the trades in loss, and sellers will come into the market. But institutions will then move the market in a bullish direction. Both sellers and buyers are out, and they will continue deriving the bullish trend in the market.
In the same way, market makers trap retail traders using double-top and triple-top patterns.
How to trade the Breakout and stop zone pattern?
To trade this price pattern, you must find the best zone to buy from; as you know, In the Breakout and stop zone, market makers do the stop-loss hunting activity. You should find a confluence of other key levels to open buy/sell trades outside this zone.
Besides the support and resistance, you must learn the following terms, which will be used as the confluence with the BSZ pattern.
- Key levels
- Flag limits
- FTR (fail to return)
Key levels are the areas from where there were a number of past price rejections. However, you must learn these technical terms in detail from our blog.
Now let me explain to open some rules to open buy or sell trades.
Open a buy trade
- Find a support zone on the candlestick chart of any currency pair or financial asset
- Near the support zone, look for double bottom or triple bottom pattern.
- Draw a zone using key level, flag limit, or FTR by analysing the past; it must form below the support zone.
- We focus on buying from this past key level instead of buying at the double bottom or triple bottom.
- Open a buy trade on the key level zone and place stop-loss below the zone.

The Recent resistance level will act as a take-profit level. However, you can also use other technical tools to determine the long take profit level.
Open a sell trade
- Find a resistance zone on the candlestick chart.
- Look for the formation of the Breakout and stop zone near the resistance zone.
- After BSZ formation, you must analyse the past by zooming out the chart. Then, draw a zone using the key levels, flag limit, or FTR. It must form above the resistance zone.
- Open a sell trade from the key level, flag limit, or ftr zone and place stop-loss above the zone.
The other support level will act as take profit level for this trade.
This is the simple way to trade the Breakout and stop zone.
The bottom line
If you want to become a profitable retail trader, you must trade uniquely. If you’re following other retail traders, you’ll lose in day trading. Learn the way of institutions and trade by following them.
BSZ is a price action pattern that helps find big traders’ activity or strategy. So retail traders can prepare instead of falling prey to stop loss hunting.

