Definition
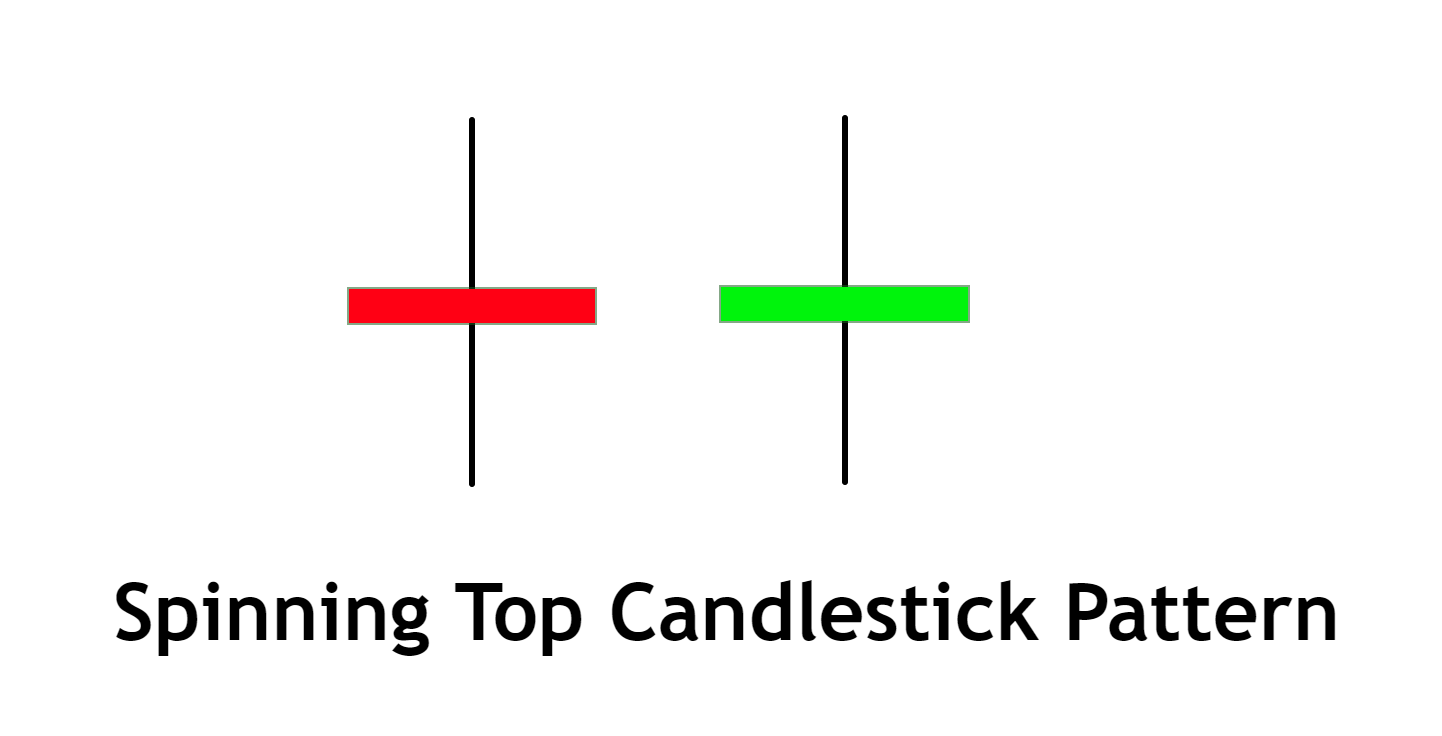
The Spinning Top candlestick pattern is a single candle pattern characterized by a short body positioned between longer upper and lower shadows, indicating indecision in the market with both buyers and sellers fighting for control, yet ending up nearly equal.
This candlestick Pattern is often observed as a sign of potential reversal, highlighting a battleground where neither buyers nor sellers have gained an upper hand. This uncertainty can lead to a change in overall trend direction, or possibly a pause in the current trend, making it an interesting pattern to monitor in various trading scenarios.
Identifying the Spinning Top Candlestick Pattern
Recognizing the Spinning Top pattern in a price chart involves the following steps:
- Look for a Candlestick with a Short Body: The Spinning Top has a small body relative to the candle’s total height. The body can be either red or green, indicating a slight move down or up respectively from the opening price.
- Long Upper and Lower Shadows: The pattern is characterized by long upper and lower shadows, almost equal in length. These long shadows signify a large trading range during the period, but a close near the opening price.
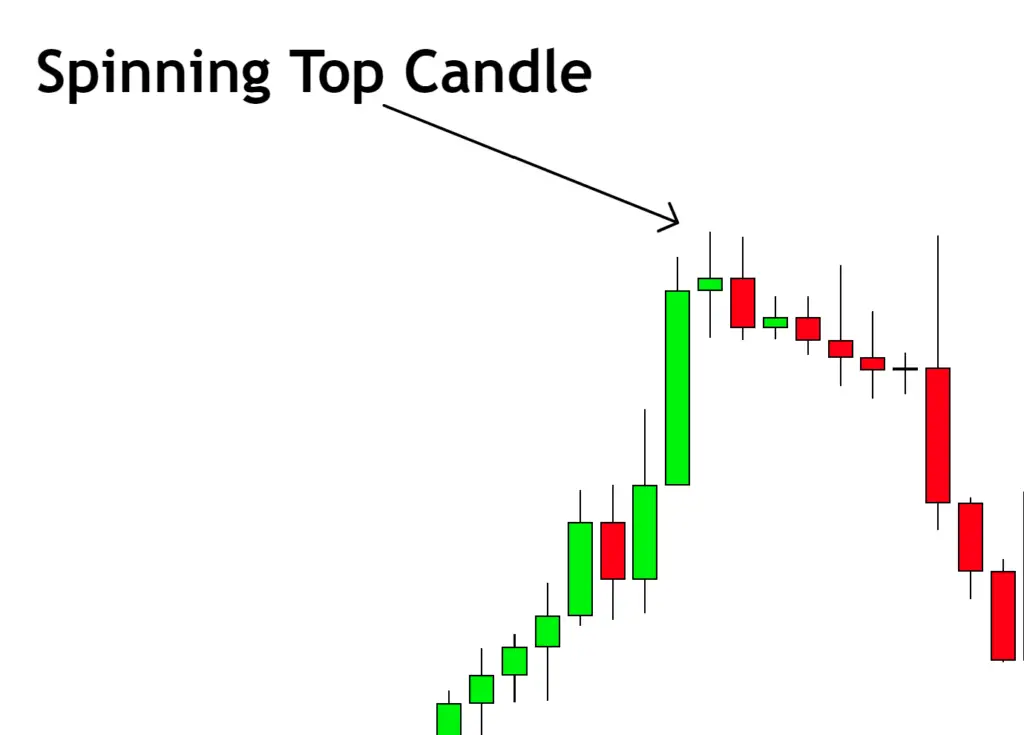
- Location in Trend: While a Spinning Top can occur anywhere in a chart, its significance is amplified when it appears after a prolonged uptrend or downtrend. In such cases, it can indicate potential reversals.
- Confirmation: The pattern should be validated with the next candle. A change in price direction following the Spinning Top lends confirmation to the potential reversal.
By being attentive to these points, traders can easily spot the Spinning Top pattern on their trading charts.
Significance and Indications
The Spinning Top Candlestick Pattern plays a crucial role in technical analysis, primarily due to the uncertainty and potential reversal it indicates.
- Market Indecision: The Spinning Top’s small body and long shadows highlight a tug of war between buyers and sellers, with neither gaining the upper hand. This suggests a potential shift in the balance of power and foreshadows potential trend changes.
- Trend Reversal or Pause: Depending on its position within an existing trend, the Spinning Top can signal an upcoming reversal or a temporary pause in the trend. For example, if it forms after a strong uptrend, it may suggest buyers are losing strength and a bearish reversal may be on the horizon.
- Confirmation is Key: As the Spinning Top indicates indecision, it’s crucial to wait for confirmation from subsequent candles before making trading decisions. A bearish or bullish candle following a Spinning Top can suggest the beginning of a new downtrend or uptrend, respectively.
By understanding these indications, traders can make more informed decisions about market entry and exit points, thereby managing their risk more effectively.
Big Traders’ Activity and the Spinning Top Candlestick Pattern
The Spinning Top candlestick pattern reveals significant information about the activities of large, institutional traders, who have the power to influence market trends.
- Indecision among Big Players: When a Spinning Top forms, it can signal that big traders are unsure about the future direction of the market. The long shadows reflect significant price swings during the trading period as large buyers and sellers try to establish control, yet by the close, neither party prevails.
- Potential Trend Shifts: Institutional traders often use this period of indecision to reassess their positions. If the market has been on a strong bullish run, big traders might start to take profits, leading to selling pressure. Conversely, in a bearish trend, they might begin buying, creating upward momentum.
- Confirmation through Subsequent Candles: Retail traders should watch how big traders react in the periods following a Spinning Top. If they see a strong bearish candle after a Spinning Top in an uptrend, it could indicate that big traders have started selling their positions. Conversely, a strong bullish candle after a Spinning Top in a downtrend could signal buying activity by these big players.
Understanding the behaviour of big traders around the formation of a Spinning Top can provide crucial insights for retail traders, allowing them to potentially anticipate market reversals and adjust their trading strategies accordingly.
Confirmations for High Probability Spinning Top Pattern
| Confirmation Tool | Description |
|---|---|
| Key Level | Observe the Spinning Top in relation to key support or resistance levels. Its presence at these significant price levels can indicate a higher probability of a potential reversal. |
| Break of High/Low After Formation | After the formation of a Spinning Top, a break of high in a downtrend or low in an uptrend in the subsequent candles can indicate a probable trend reversal. |
| High Volume | If the Spinning Top is accompanied by high volume, it shows a strong conflict between buyers and sellers, enhancing the indecision factor of this pattern, hence increasing its significance. |
| Technical Indicators | Confirmation from other technical indicators like RSI, MACD or Stochastic Oscillator can add to the reliability of the pattern. For example, divergence with RSI could strengthen the reversal prediction. |
Ideal Conditions for Spinning Top Trading
Best Timeframe: The Spinning Top pattern can be spotted on any timeframe, but it’s generally more reliable on higher timeframes like the 1H, 4H, or Daily chart. The longer the timeframe, the more substantial the price indecision represented.
Trading Session: This pattern can occur in any trading session, but it may hold more significance if it appears during a session with high liquidity, such as the London or New York trading sessions.
Winning Ratio: Like all trading patterns, the Spinning Top doesn’t guarantee success. However, when used in conjunction with other confirmatory tools, it could offer a winning ratio of around 60-65%.
Spinning Top Trading Strategy and Confluence Factors
- Entry: Identify a potential entry point after a Spinning Top pattern appears at a significant level of support or resistance. The entry point should be triggered by another confirmation, such as the next candlestick closing above (for a bullish reversal) or below (for a bearish reversal) the Spinning Top.
- Stop Loss: Set your stop loss slightly below the lowest point of the Spinning Top for a bullish reversal, or slightly above the highest point of the Spinning Top for a bearish reversal. This protects against the potential that the pattern is part of a continuation rather than a reversal.
- Take Profit: The take profit level could be set at the next significant resistance (for a bullish trade) or support level (for a bearish trade). Alternatively, traders may choose to use a risk-reward ratio, such as 1:2 or 1:3, to determine their take profit point.
Conclusion
A Spinning Top pattern is a clear indication of market indecision and potential reversal. However, like any trading strategy, it’s crucial to use additional tools for confirmation and to always adhere to proper risk management principles. Always remember, no pattern is 100% foolproof, and the Spinning Top pattern should be used as part of a broader, well-rounded trading strategy.

