Definition
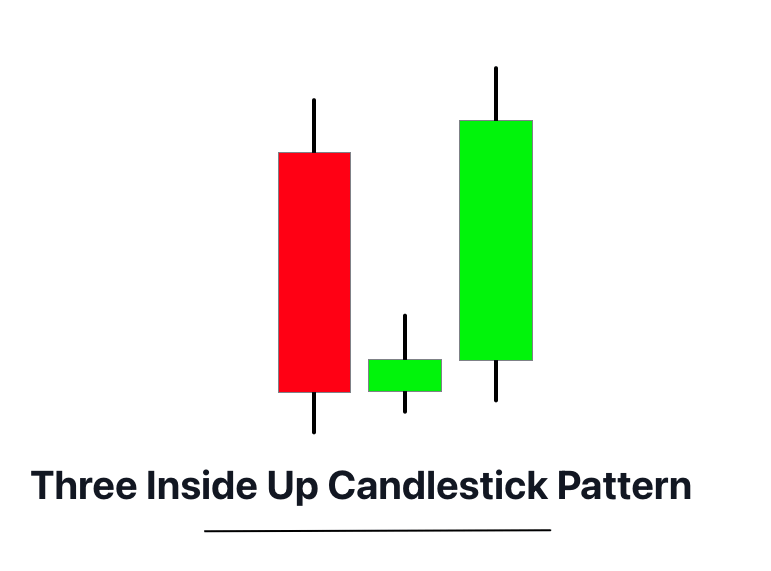
The Three Inside Up is a bullish reversal candlestick pattern consisting of three candles: a large bearish candle, a smaller bullish candle fully contained within the range of the first candle, and a third bullish candle closing above the high of the first candle.
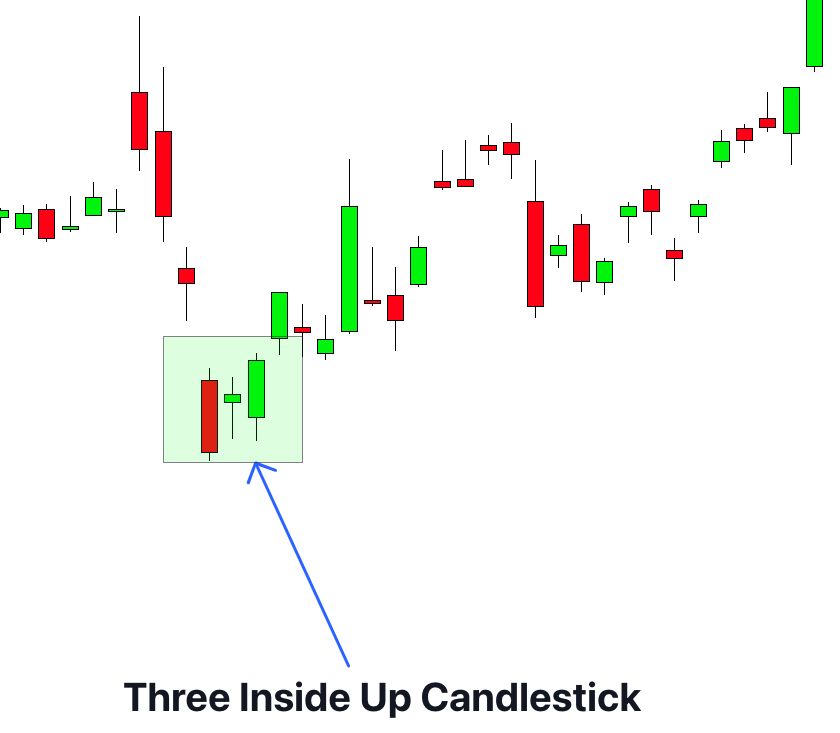
Often spotted during a downtrend, the Three Inside Up pattern signals a potential shift in sentiment from sellers to buyers, indicating that the market could be on the verge of a reversal to the upside.
How to identify the Three Inside Up Candlestick Pattern?
Sure, here’s how to identify the Three Inside Up pattern:
- Trend Before the Pattern: The pattern typically forms during a downtrend. This is when the bears have control and the price is moving down.
- First Candle: The first candle is a long bearish candle, indicating that sellers are still in control.
- Second Candle: The second candle is a small bullish candle, indicating a potential change in market sentiment. It is fully contained within the body of the first candle.
- Third Candle: The third candle is a bullish candle that closes above the high of the first candle, confirming the reversal. This indicates that buyers have gained control.
- Confirmation: Confirmation of the reversal pattern comes with the third candle’s close above the high of the first candle.
Significance
The Three Inside Up candlestick pattern holds significant importance in technical analysis because of its indication of a potential bullish reversal. This pattern forms during a downtrend and suggests that the bears may be losing control while the bulls are starting to take over.
The first long bearish candle suggests that the selling pressure is still dominant. However, the second small bullish candle hints at a shift in sentiment, showing that the bears are losing their grip and the bulls are ready to step in. The third bullish candle, which closes above the high of the first candle, solidifies the potential bullish reversal.
This pattern is highly valuable for traders looking to time their entries for a potential uptrend.
Activity of market makers behind the chart
The formation of the Three Inside Up pattern reveals some insightful information about the activities of big players or institutional traders in the market. It’s important to understand that these major participants have the potential to move the market significantly, due to the large size of their trades.
As the first bearish candle forms, it reflects the continuation of the current bearish sentiment driven by big traders. However, the appearance of the second small bullish candle indicates a decrease in selling pressure, suggesting that big players might be closing their short positions or even starting to build long positions.
Finally, the third candle, which is a bullish one that closes above the high of the first candle, is a strong indication of a shift in the market sentiment. This is potentially a result of big traders initiating more significant long positions, driving up demand and, consequently, the price.
By understanding these underlying dynamics, retail traders can potentially align their trades with the direction favoured by big traders, thereby increasing their chances of success.
Confluences
| Confirmation Tool | Description |
|---|---|
| Key Level | Look for the formation of the Three Inside Up near significant support levels. This increases the likelihood of a strong bullish reversal. |
| Pattern Break | A bullish candlestick closing above the high of the first candle in the pattern provides a good confirmation. |
| High Volume | An increase in volume on the third candle of the pattern signifies stronger buying pressure, confirming the bullish reversal. |
| Technical Indicators | Reversal confirmation can be further validated using indicators such as RSI, moving averages, or MACD. For instance, an oversold condition on RSI or a bullish crossover on MACD strengthens the reversal signal. |
Key Points
- Best Timeframe: The Three Inside Up candlestick pattern can be spotted in various timeframes, but it carries more weight and reliability on higher timeframes, such as the 1-hour, 4-hour, or daily charts.
- Trading Session: This pattern can be traded effectively in any trading session, given that it is a universal pattern. However, it is best to focus on the sessions where the particular instrument you are trading has the highest liquidity, such as the London session for most forex pairs.
- Winning Ratio: Like any trading pattern, the Three Inside Up doesn’t guarantee a win. Its effectiveness depends on the trader’s skill, risk management, and market context. However, under the right conditions and with good confirmations, traders can expect a rough winning ratio of around 60-65%.
Trading Strategy
- Key Level Confluence: Firstly, identify a key level of support where price has previously reacted. The stronger the level, the better – consider historical support and resistance, Fibonacci retracements, or moving averages. The occurrence of the Three Inside Up pattern at this level increases its reliability.
- Entry: After spotting the Three Inside Up pattern at a key level, you’d enter a long trade at the open of the next candle following the pattern.
- Stop Loss: Set the stop loss a few pips below the low of the pattern. This level represents a zone where the market has shown it doesn’t want to go; if it does, it invalidates the trade idea.
- Take Profit: The take profit level could be a key resistance level above your entry or a predetermined risk-reward ratio like 1:2 or 1:3, depending on the overall market structure and volatility.
Conclusion
The Three Inside Up pattern can be a powerful signal of a bullish reversal when it appears at key levels and is confirmed by other technical analysis tools. Despite the simplicity of its concept, it requires a good understanding of market structure and prudent risk management for effective trading. Always test new strategies on a demo account before going live.

