Definition
A bullish Marubozu candlestick in technical analysis is a type of price pattern observed in candlestick charting of financial markets. The term “Marubozu” is derived from Japanese, and it essentially means “shaved” or “bald”.
How to identify the bullish marubozu?
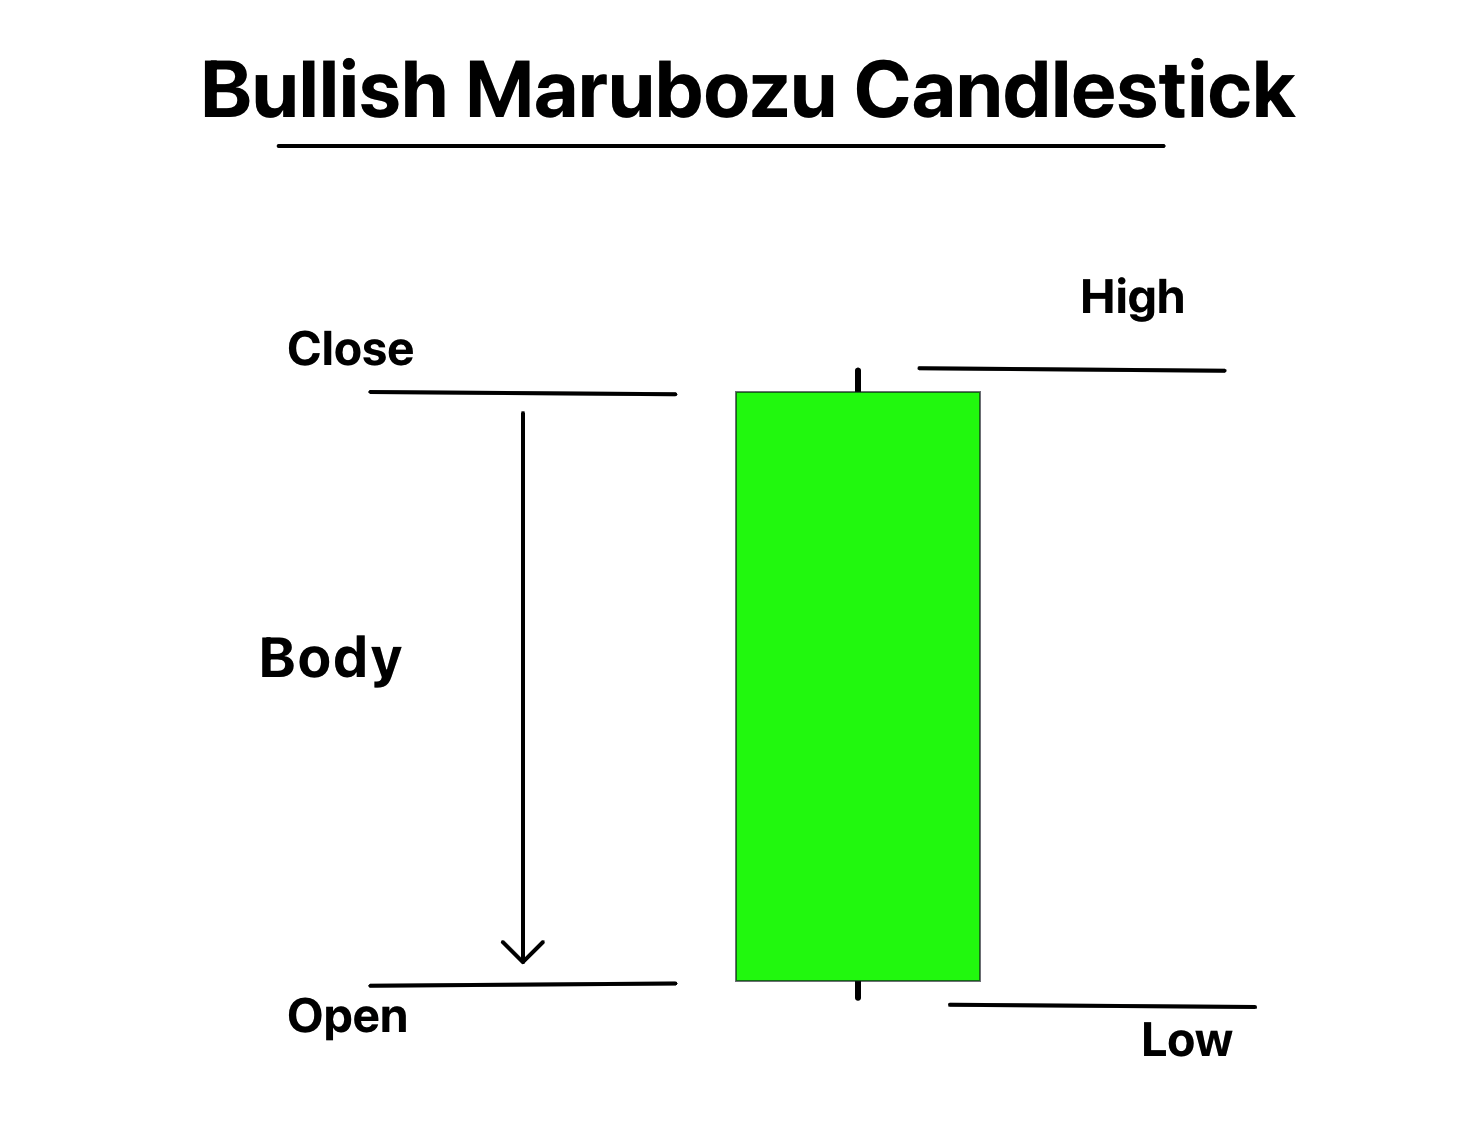
The bullish Marubozu candlestick is characterized by the following features:
- A long body: This represents a significant difference between the opening and closing prices within the period the candlestick represents (e.g., a day, an hour, a week, etc.). The length of the body is indicative of the strength of the buying pressure.
- No or very short wicks (shadows): This means the opening price was the low and the closing price was the high for the period, suggesting that buyers controlled the price from the opening bell to the closing bell.
- The color of the body is usually white or green, depending on the chart settings, indicating that the closing price was higher than the opening price.
When a bullish Marubozu appears, it is generally interpreted as a very bullish signal, meaning that there is a strong buying interest and upward price momentum in the market. However, as with all technical analysis tools, it’s important to use the Marubozu candlestick pattern in conjunction with other indicators or patterns to confirm potential buy signals and avoid false signals.
Significance
In technical analysis, the bullish Marubozu candlestick has significant importance due to the following reasons:
- Strong Buying Pressure: The presence of a bullish Marubozu indicates strong buying pressure. The longer the candlestick, the more intense the buying pressure. This is signified by the lack of a lower wick, meaning the opening price was the low for the period, and the lack of an upper wick, meaning the closing price was the high for the period.
- Bullish Signal: A bullish Marubozu can be a strong bullish signal, suggesting a continued upward trend, particularly when it appears at the end of a downtrend or in a consolidation period. Traders often see it as a sign of a potential reversal from a bearish to a bullish market.
- Confirmation of Trend: If a bullish Marubozu appears in an already established uptrend, it can confirm the existing bullish sentiment and signal the continuation of the trend.
- Price Support Level: The high price of the bullish Marubozu often becomes a future support level because it reflects a price at which there was significant buying interest.
However, while the bullish Marubozu can be a powerful signal, it should not be used in isolation. It’s important to consider the overall market trend, the volume during the period of the Marubozu (since higher volume can add credibility to the signal), and other technical indicators. A single candlestick pattern, no matter how powerful, should always be part of a larger analysis strategy. Traders may also want to wait for additional confirmation (such as another bullish candlestick or a bullish gap up) before making a trading decision based on a bullish Marubozu.
Activity of traders behind the chart on formation of Marubozu candlestick pattern
The formation of a bullish Marubozu candlestick tells a story of the traders’ activity during that particular time period. Here’s what generally happens:
- Opening Bell: The market opens and trading begins. In the case of a bullish Marubozu, the opening price is the lowest price of the session. This means that buyers step in almost immediately, preventing the price from going any lower.
- Buyer Domination: Throughout the trading session, buyers maintain control. They continue to buy at higher and higher prices, driving the price up. This consistent buying pressure means that there is no significant pullback, which would be represented by a lower wick (or shadow) on the candlestick.
- Absence of Seller Counteraction: The lack of an upper wick indicates that sellers are not able to push the price down from the high by the end of the session. The absence of this counteraction from the sellers underscores the dominance of the buyers during this period.
- Closing Bell: The session ends at the highest price point of the session, meaning that the closing price is the high. This demonstrates that buyers were willing to continue purchasing the asset right up until the end of the trading session.
The formation of a bullish Marubozu candlestick, therefore, signifies strong bullish sentiment and aggressive buying activity during the entire trading period. It suggests that buyers were in complete control from the opening to the closing of the market, with sellers being largely absent or ineffective. This can be a powerful signal of continued bullish momentum, especially if accompanied by high trading volume. As always, however, it’s important to consider this signal in the context of other technical and fundamental market factors.
Confirmation
here’s a table that outlines some factors that could be used to confirm a Bullish Marubozu candlestick:
| Confirmation Factor | Description |
|---|---|
| Prevailing Trend | A Bullish Marubozu may carry more weight if it appears during a downtrend or at a support level, as it could signal a potential bullish reversal. In an existing uptrend, it may signify trend continuation. |
| Volume | Higher trading volume during the formation of the Marubozu candle can strengthen the signal, as it suggests stronger buying conviction. |
| Next Candlestick | The candlestick that forms immediately after the Marubozu can provide confirmation. For instance, another bullish candlestick or a gap up can reinforce the bullish signal. |
| Technical Indicators | Bullish signals from other technical indicators can confirm the Marubozu. This could include a bullish moving average crossover, a bullish MACD crossover, an oversold RSI turning up, etc. |
| Support and Resistance Levels | If the Marubozu breaks through a known resistance level or bounces off a known support level, it could reinforce the bullish signal. |
Remember, the key to successful trading isn’t just about identifying patterns but also effectively managing risk. It’s highly recommended to use a combination of tools and techniques to confirm signals and manage risk. Always test any strategy in a simulated or paper trading account before using it in a live trading environment.
Timeframe and Trading Session
The Bullish Marubozu candlestick can be utilized in any timeframe, from short-term intraday charts to longer-term daily and weekly charts. However, it’s generally considered more reliable in longer timeframes, as these can help filter out market noise and provide a clearer view of overall market sentiment.
As for the best trading session, it largely depends on the market you’re trading in. In 24-hour markets like forex, high-liquidity periods like the New York-London overlap may offer more reliable signals.
For stock markets, the regular trading hours of the respective exchange would be the appropriate session. Remember, the Bullish Marubozu, like all technical analysis tools, should be used in conjunction with other indicators and tools to confirm signals and manage risk.
Marubozu Trading Strategy
Trading a Bullish Marubozu candlestick pattern in confluence with a support zone can be a powerful strategy. The following steps outline how to do this:
- Identify a Support Zone: Look for an established support zone on your chart. This could be a historical price level where the asset’s price has bounced back up multiple times, indicating strong buying interest.
- Wait for a Bullish Marubozu: Wait for a Bullish Marubozu candlestick to form at the identified support zone. The formation of this pattern at a support zone can be a strong bullish signal, as it indicates strong buying pressure at a price level where buyers have stepped in before.
Once you have confirmed the signal, here’s how you might set your entry, stop loss, and take profit:
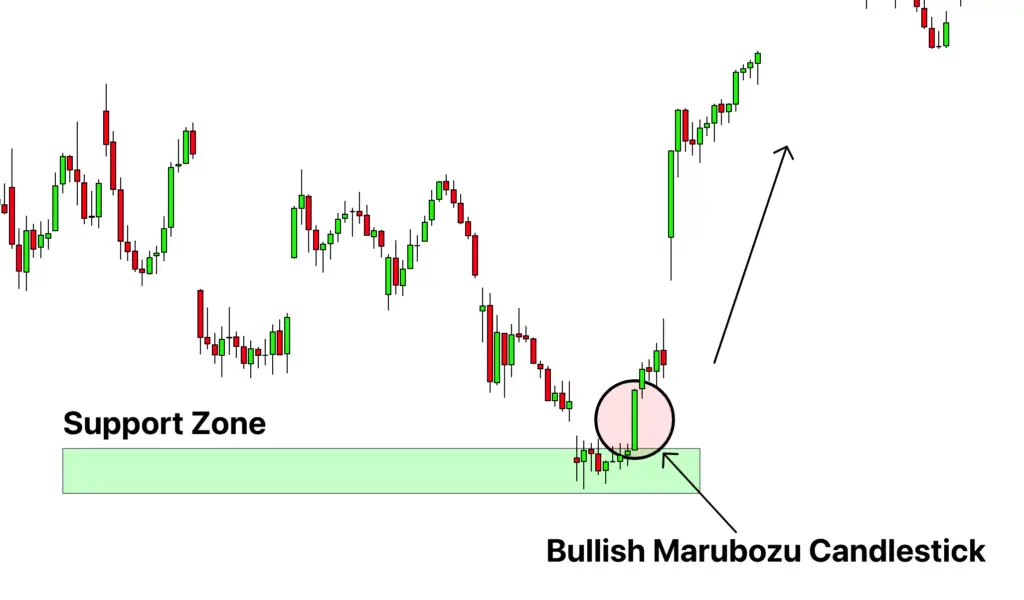
Entry: Enter the trade after the Bullish Marubozu closes. The confirmation of a Bullish Marubozu at a strong support level with additional confirming indicators provides a good entry point.
Stop Loss: Set a stop loss just below the support level or the low of the Marubozu candlestick. This protects you in case the price reverses and breaks down through the support level.
Take Profit: Your take profit level will depend on your personal risk/reward ratio and your analysis of the market. One common approach is to look for the next significant resistance level as your initial take profit level, as this is a price level where the asset may face selling pressure. You could also use a trailing stop to capture more profit if the price continues to rise.
Remember, this is just one potential strategy for trading the Bullish Marubozu. The effectiveness of any trading strategy can vary based on many factors, and it’s important to practice good risk management and to test any new strategy in a simulated environment before risking real money.
Conclusion
The Bullish Marubozu is a powerful candlestick pattern in technical analysis that can provide a strong signal of bullish sentiment in the market. It’s characterized by a long green or white body with no or very short wicks, indicating that buyers controlled the price action from the opening to the closing of the market.
As a new trader, you can use this pattern to identify potential buying opportunities, particularly when it forms at a support level or during a downtrend. However, it’s essential to use it in conjunction with other indicators and tools to confirm the signal and manage risk.
Always remember that no single pattern or indicator should be used in isolation, and the key to successful trading is a well-rounded strategy that includes a strong focus on risk management.

