Definition
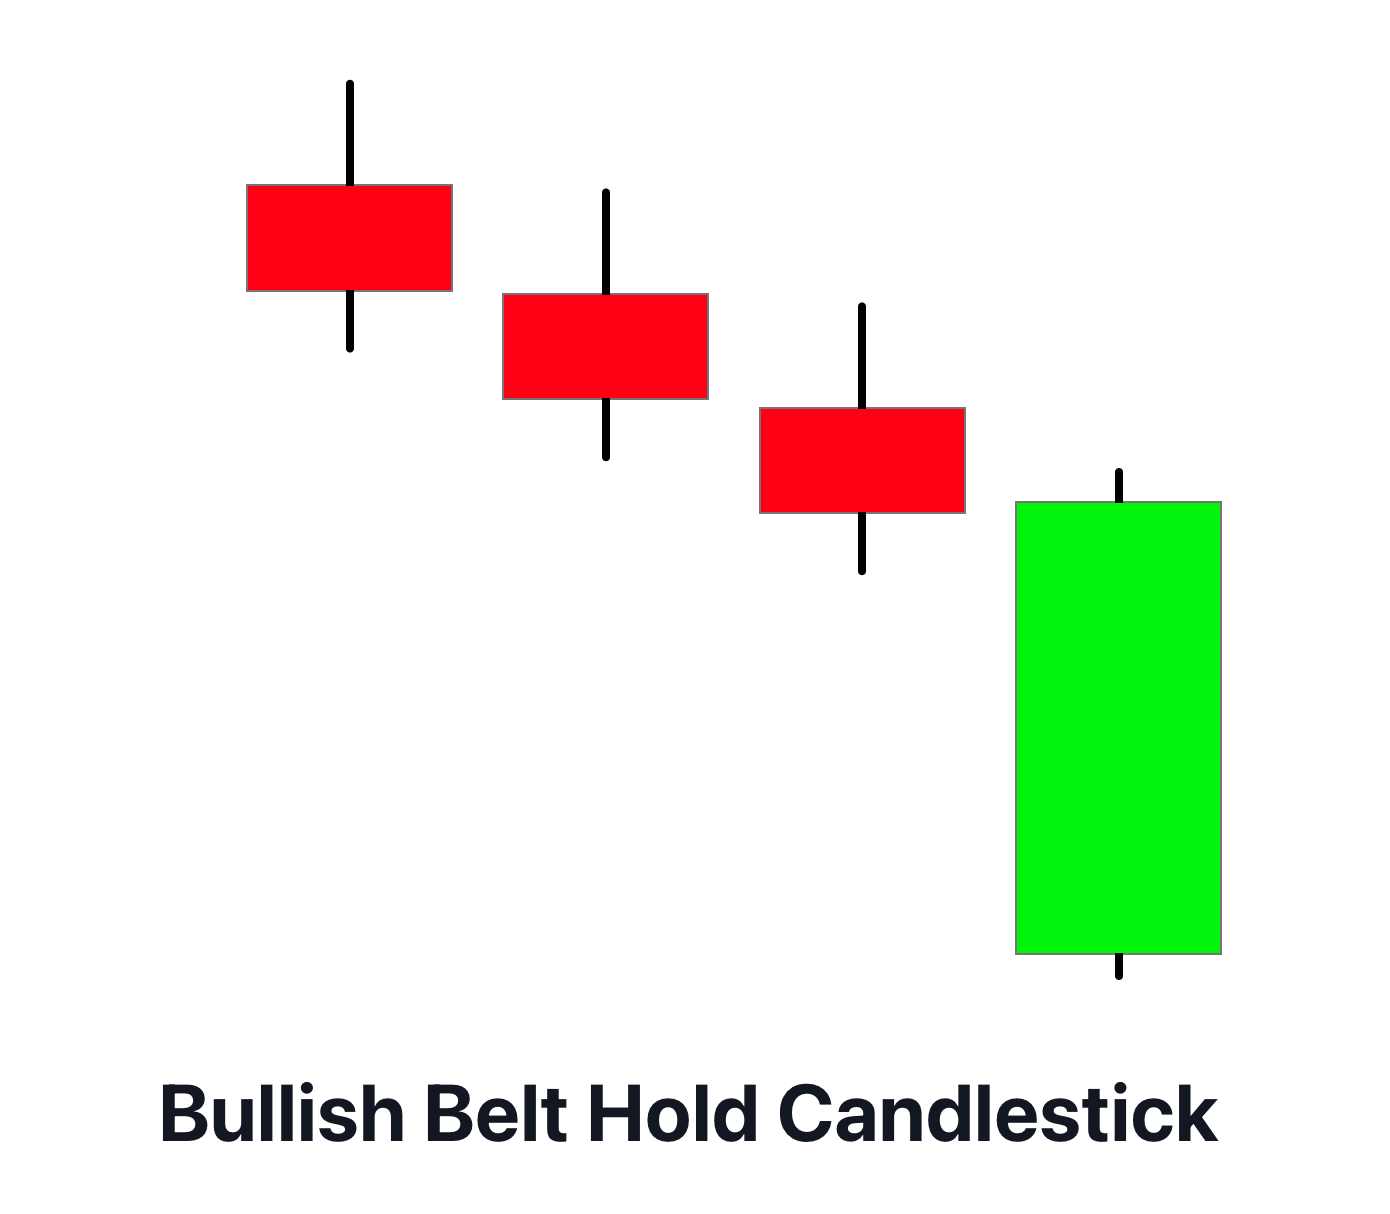
A Bullish Belt Hold pattern is a single candlestick pattern that consists of a long white (or green) body with no lower shadow and a small upper shadow, representing a strong move by bulls after the market opens at its low.
Considered a reliable sign of a potential upward reversal in a downtrend, the Bullish Belt Hold acts as a beacon to traders, signaling the bulls have wrestled control from the bears and might continue to push the market upwards.
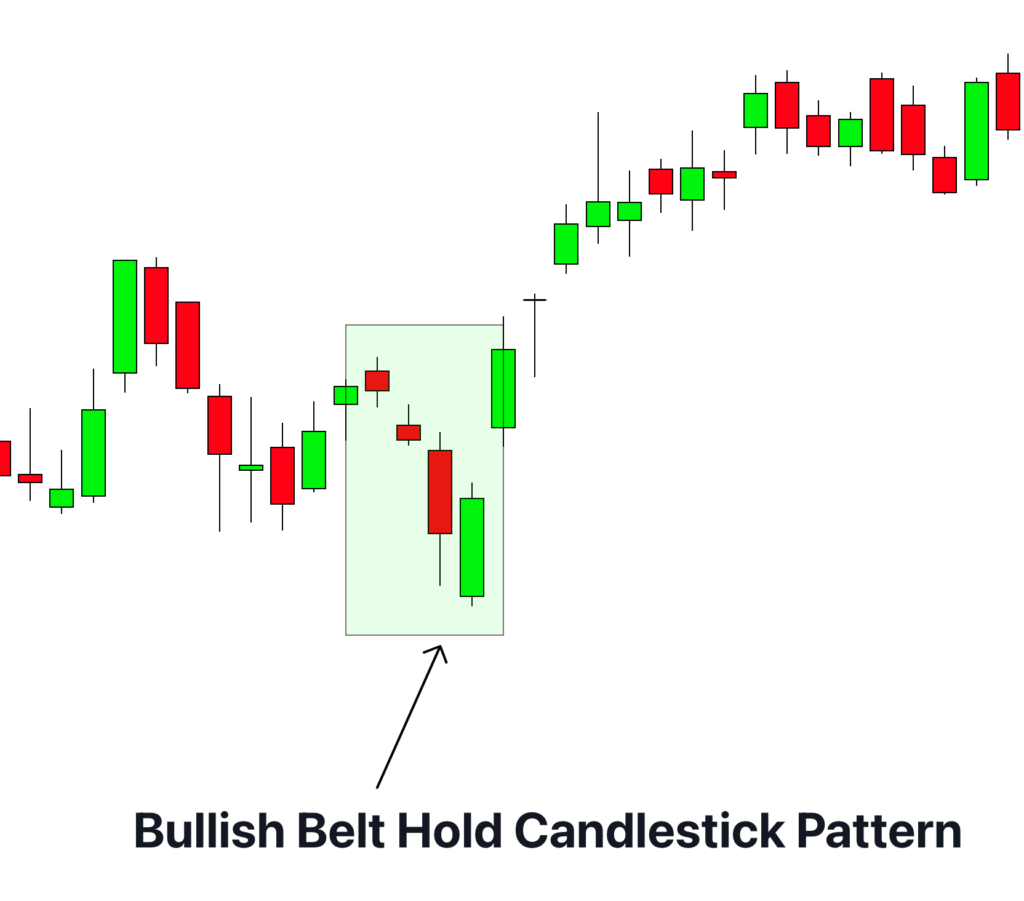
How to identify the Bullish Belt Hold Candlestick Pattern on chart?
To identify a Bullish Belt Hold pattern on the chart, you should look for the following:
- Downtrend Precedence: This pattern typically occurs during a downtrend. Make sure the market was bearish before the pattern appears.
- Open at Low: The candlestick of the pattern opens at its low, meaning there is no lower shadow.
- Long White Body: The candlestick has a long white (or green) body, signifying a strong buying pressure throughout the trading period.
- Small Upper Shadow: Although the candlestick may have a small upper shadow, it’s not a requirement. However, a candlestick with a smaller upper shadow typically indicates a stronger bullish signal.
- Single Candle Pattern: The Bullish Belt Hold is a single candlestick pattern, meaning it forms over one trading period.
Significance
The Bullish Belt Hold pattern is a significant signal in technical analysis, indicating the potential reversal of a bearish trend. The pattern demonstrates the shift from selling pressure to buying pressure during the trading session.
Its occurrence after a downtrend suggests that bears opened the session with selling, aiming to continue the downtrend. However, bulls take control during the session, pushing the price upward, and close near the high of the session. This shift of control from bears to bulls signifies a change in market sentiment and could be the start of an uptrend.
Though it’s a strong signal on its own, it is always advised to wait for additional confirmation through other technical analysis tools or further bullish movement in the next trading period to validate the reversal signal.
Psychology behind formation of the Bullish Belt Hold
When a Bullish Belt Hold pattern forms, it indicates a significant shift in the market dynamics where the big players or institutions are changing their stance. The fact that the market opened at the low and closed near the high suggests that larger investors, who have the capacity to influence the market, have started accumulating positions. They likely see value at these levels, which explains the shift from a bearish to a bullish sentiment.
In essence, the formation of a Bullish Belt Hold represents a tug-of-war between sellers and buyers, where the buyers have gained the upper hand by the end of the trading session. Understanding this behavior of institutional investors is critical for retail traders, as it can help them align their trading decisions with the market’s likely direction.
Confirmation Tools
| Confirmation Tool | Description |
|---|---|
| Key Level | The Bullish Belt Hold pattern holds more significance if it forms at a key support level. This can signal a likely bullish reversal. |
| Volume | A high trading volume on the day the Bullish Belt Hold pattern forms indicates strong buyer interest and adds credibility to the pattern. |
| Oscillator Divergence | If a bullish divergence on an oscillator like RSI or MACD accompanies the Belt Hold pattern, it adds further confirmation to the bullish reversal. |
| Trend Line or Moving Average Break | If the pattern forms at the same time the price breaks above a descending trend line or a significant moving average, it can add weight to the bullish reversal signal. |
Key Points to remember
Best Timeframe: The Bullish Belt Hold pattern can be traded on multiple timeframes, but it tends to be more reliable on higher timeframes such as the daily or weekly charts. This allows for better confirmation and reduces noise in the price action.
Trading Session: The Bullish Belt Hold pattern can be traded in any trading session, as it represents a significant shift in market sentiment. However, it is essential to consider the liquidity and volatility of the chosen session for optimal trading conditions.
Winning Ratio: The winning ratio of the Bullish Belt Hold pattern will vary depending on market conditions and the trader’s ability to properly identify and interpret the pattern. While there is no fixed winning ratio, with proper confirmation and risk management techniques, traders can aim for a winning ratio of around 60% or higher.
Bullish Belt Hold Trading Strategy
- Identify the Bullish Belt Hold pattern: Look for a strong bullish candlestick with a small or non-existent upper shadow and a long lower shadow, indicating a potential reversal pattern.
- Confirm with Support Zone: Identify a significant support zone on the chart where the price has previously found support and reversed. This adds confluence to the pattern and increases the probability of a successful trade.
- Entry: Enter a long position when the Bullish Belt Hold pattern forms at or near the identified support zone. This confirms the potential reversal and provides a favorable entry point.
- Stop Loss: Place a stop loss below the low of the Bullish Belt Hold candlestick pattern. This helps protect the trade in case the reversal does not materialize as expected.
- Take Profit: Set a profit target based on the distance from the entry point to the nearest resistance level or based on a predetermined risk-to-reward ratio. This ensures that potential profits are captured while considering the overall market conditions.
- Risk Management: Ensure that the risk per trade is within acceptable limits and aligns with your trading plan. Consider position sizing based on the distance between the entry point and stop loss level.
Conclusion
The Bullish Belt Hold pattern, when combined with confluence from a support zone, can provide traders with an actionable trading opportunity. It suggests a potential trend reversal from bearish to bullish, with the support zone adding additional strength to the trade setup. However, it is essential to use proper risk management techniques and consider other factors such as market context and overall trend analysis to enhance the trading strategy’s effectiveness.

