The Morning Doji Star is a bullish reversal candlestick pattern that is used in technical analysis. It’s typically found at the end of a downtrend and can signal a potential reversal in the market sentiment from bearish to bullish.
It is a three-candle bullish reversal pattern that appears at the end of a downtrend, signaling a potential shift in market sentiment from bearish to bullish.
How to find the Morning Doji Star?
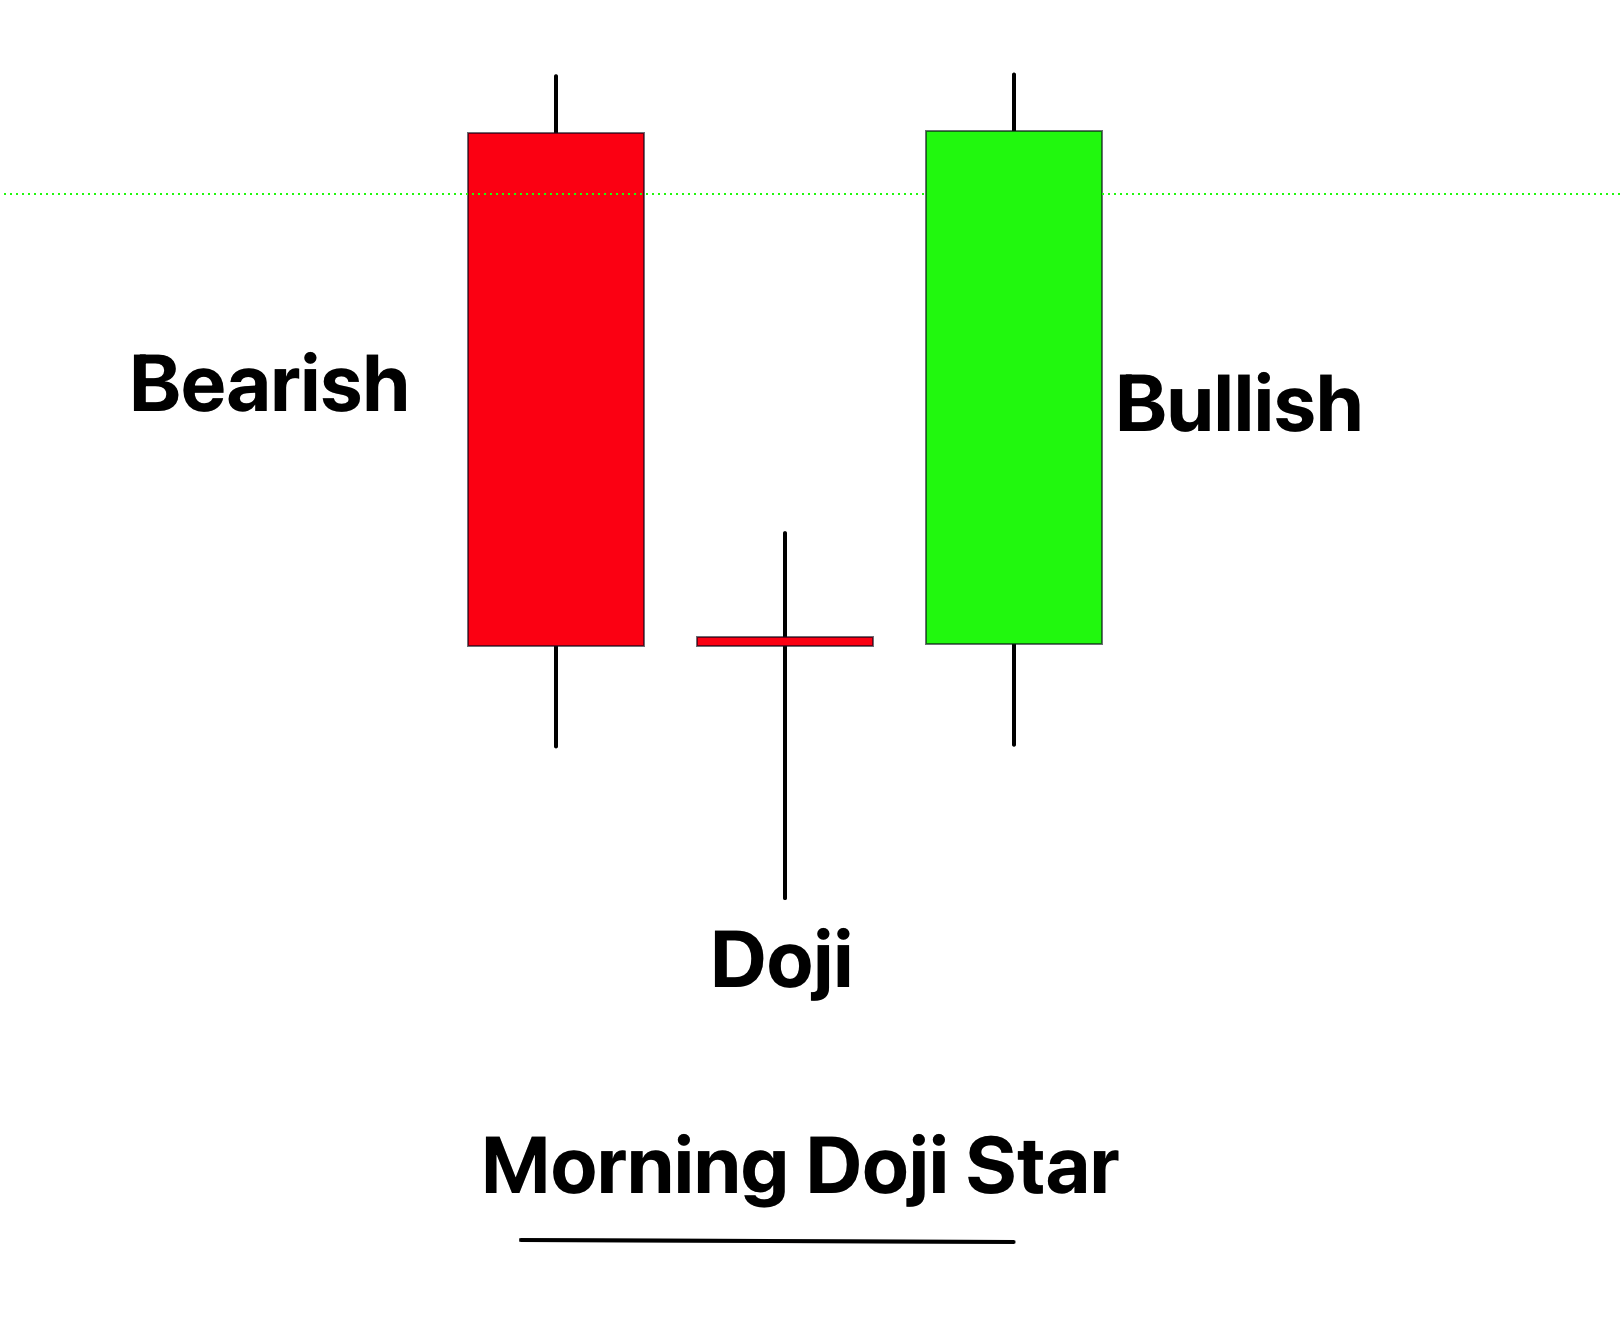
The pattern is composed of three candlesticks:
- First Candle: A long bearish (red or black) candle, continuing the existing downtrend.
- Second Candle: A Doji, which is a candle where the opening and closing prices are virtually the same. This candle gaps down from the first candle, meaning it opens lower than the first candle’s close, suggesting further bearish sentiment at the opening, but then the price fails to move significantly in either direction.
- Third Candle: A bullish (green or white) candle that gaps up from the Doji, meaning it opens above the Doji’s close, and closes within, or above, the body of the first candle. This suggests a potential shift in sentiment from bearish to bullish.
This pattern represents a potential change in investor sentiment, with the market moving from a strong downtrend (first candle), to a period of indecision (Doji), and finally showing signs of a potential uptrend (third candle).
Significance
The Morning Doji Star holds considerable significance in technical analysis as a potential indicator of a bullish reversal. Appearing at the end of a downtrend, this pattern signals a possible shift in market sentiment from bearish to bullish, suggesting that buyers are regaining control from sellers.
The first candlestick in the pattern, a long bearish candle, illustrates strong selling pressure. The second candlestick is a Doji, signifying indecision in the market as neither buyers nor sellers are able to gain control. The final candlestick is a strong bullish one, indicating that buyers have overcome sellers and are starting to push prices up.
This shift from clear bearish dominance to a stalemate, and then to bullish dominance, can be a powerful signal for traders.
Activity of traders in the market
The formation of a Morning Doji Star candlestick pattern reflects a shift in trading dynamics and sentiment from bearish to bullish. Let’s break down the activity of traders during the formation of each candlestick in the pattern:
- First Candle (Bearish): The market is in a clear downtrend, dominated by sellers. The opening price is high, and throughout the period, sellers push the price down, causing it to close near the low of the period. This strong bearish activity confirms the continuation of the existing downtrend.
- Second Candle (Doji): At the opening, the price gaps down from the previous close, which initially suggests that the bearish sentiment is continuing. However, throughout the period, neither buyers nor sellers are able to take definitive control. The price doesn’t move significantly and closes very close to the opening price, forming a Doji. This indicates indecision and a potential weakening of the bearish sentiment.
- Third Candle (Bullish): The price opens higher than the close of the Doji, suggesting an increase in buying pressure. Buyers manage to push the price up during the period, and the price closes well into the body of the first candlestick, forming a bullish candle. This strong buying activity signifies a shift in market sentiment from bearish to bullish.
The Morning Doji Star pattern, therefore, tells the story of a market transitioning from a bearish trend to a potential bullish reversal.
Confirmation
Here are a few factors that help to find a high probability morning doji star.
| Confirmation Factor | Description |
|---|---|
| Bearish Prior Trend | The Morning Doji Star is a reversal pattern, so its effectiveness increases when it appears after a clear downtrend. |
| Resistance Zone | If the pattern forms near a significant resistance zone, the effectiveness of the bullish reversal signal can increase. A resistance zone is a price level at which an asset’s price has struggled to move above historically. |
| High Trading Volume | Increased trading volume on the third day (the bullish candle) of the Morning Doji Star can validate the pattern, as it indicates strong buying pressure. |
| Oversold RSI | If the Relative Strength Index (RSI) indicates that the asset was oversold (typically an RSI value below 30) during the formation of the Morning Doji Star, it can strengthen the reversal signal. An oversold RSI reading can suggest that the asset’s price might bounce back. |
Key points for morning doji star
Best Timeframe: The Morning Doji Star pattern can be identified across multiple timeframes, but its significance is often greater on longer timeframes such as the daily or weekly charts. This is because longer timeframes typically filter out the ‘noise’ of shorter term price fluctuations and provide a clearer depiction of market sentiment.
Best Trading Session: Trading sessions can vary depending on the market you’re trading. For instance, in forex, high liquidity sessions like the London-New York overlap can be favorable, whereas for stocks, the regular trading hours of the respective exchange would be most relevant.
Winning Ratio: The Morning Doji Star could have an accuracy rate around 70-80% when confirmed with other technical indicators.
Morning doji star trading strategy
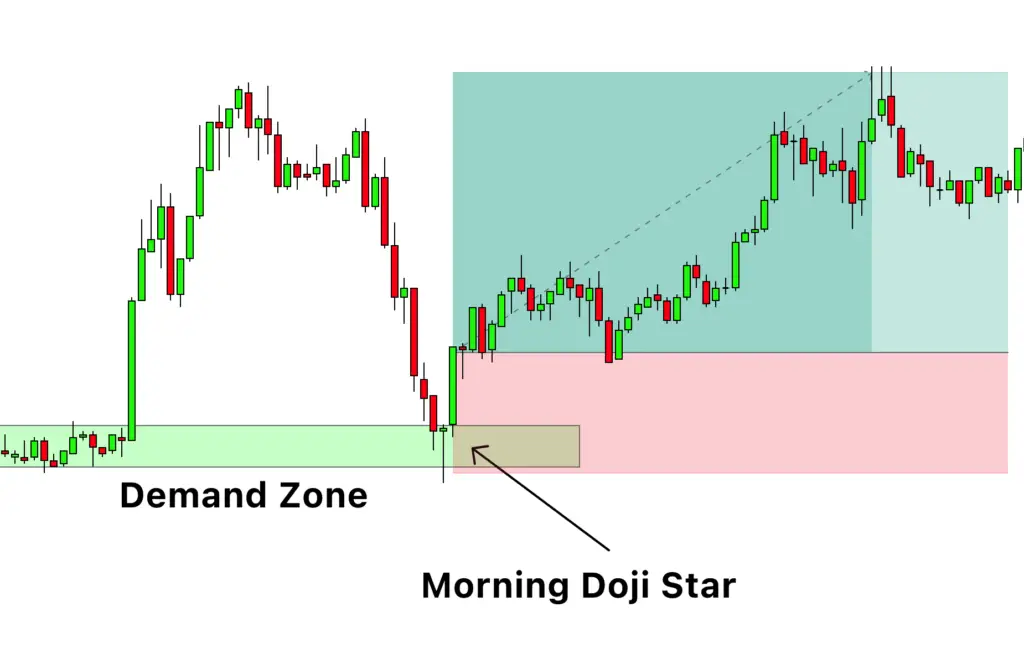
Trading a Morning Doji Star pattern with the confluence of a demand zone can be an effective strategy for identifying potential buying opportunities. Here’s how you might do it:
- Identify a Demand Zone: Look for an established demand zone on your chart. This could be a historical price level where the asset’s price has reversed from bearish to bullish, indicating strong buying interest.
- Wait for a Morning Doji Star: Wait for a Morning Doji Star to form at the identified demand zone. The formation of this pattern at a demand zone can be a strong bullish signal, indicating a potential reversal of the bearish sentiment.
Once you’ve confirmed the signal, here’s how you could set your entry, stop loss, and take profit:
Entry: Enter the trade after the confirmation of the Morning Doji Star. The third candle’s close could be your entry point, as it confirms the bullish reversal.
Stop Loss: Place a stop loss just below the low of the Morning Doji Star pattern. This would protect you if the price were to move downwards instead of following the anticipated bullish trend.
Take Profit: Your take profit level will depend on your personal risk/reward ratio and your analysis of the market. One common approach is to look for the next significant resistance level as your take profit level, as this is a price level where the asset might face selling pressure. Alternatively, you could use a trailing stop to capture more profit if the price continues to rise.
Conclusion
This pattern, typically seen at the end of a downtrend, offers traders an opportunity to enter the market at the beginning of a new uptrend. However, like all trading strategies, it’s important to use this pattern in conjunction with other indicators to confirm trading signals and manage risk.
A successful trader must also consider the overall market context, apply good risk management practices, and maintain discipline in following their trading plan.

