Definition
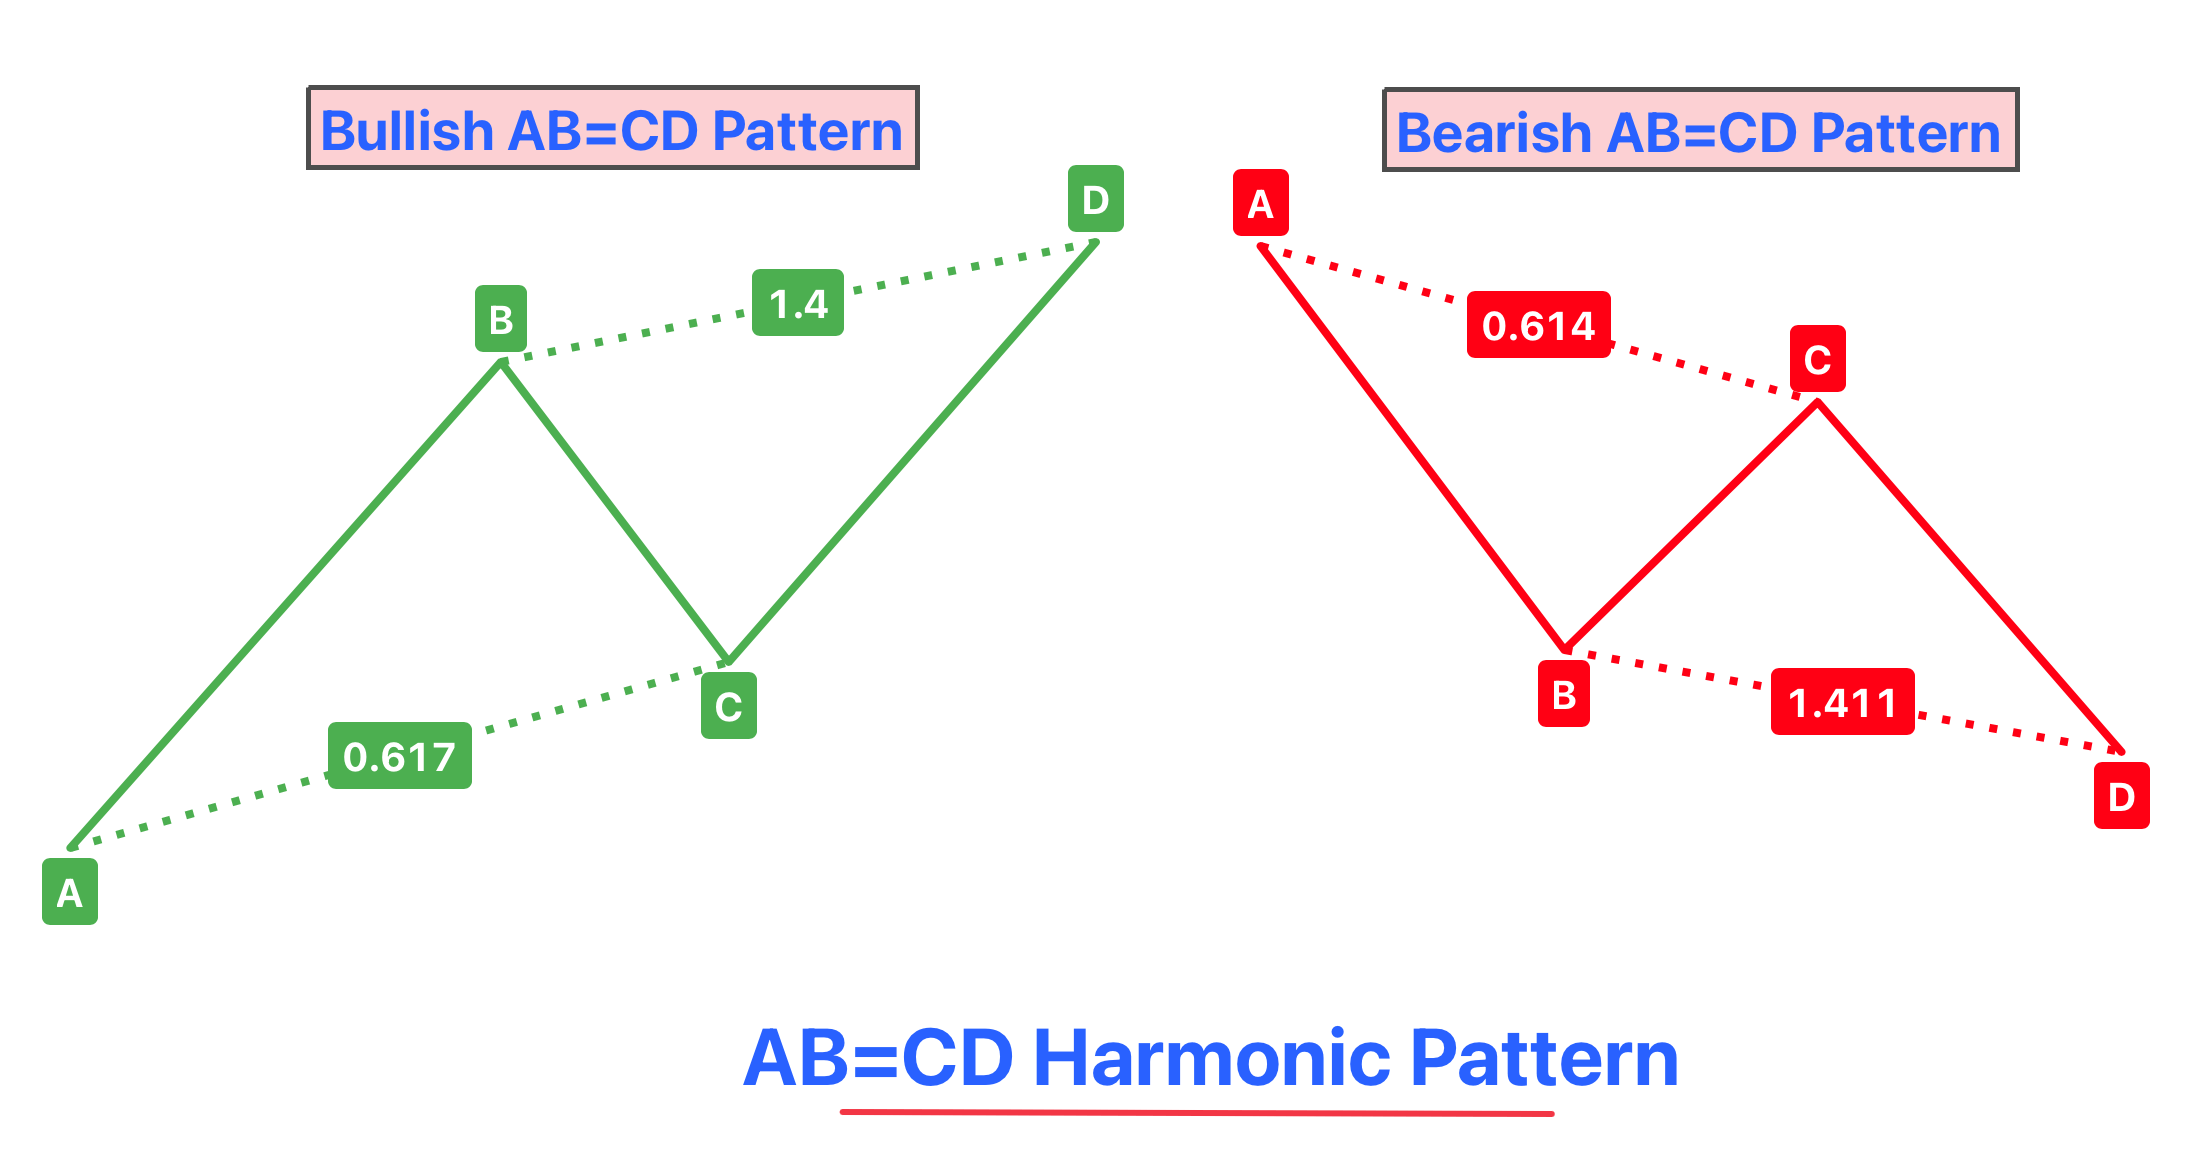
The AB=CD pattern is a fundamental harmonic chart pattern recognized by traders in various financial markets. It’s characterized by two equivalent price legs, suggesting a symmetry in price movements of a stock or asset. This pattern is made up of four key points – A, B, C, and D – forming two legs: AB and CD. The uniqueness of this pattern lies in the fact that the length of the AB leg is typically mirrored in the CD leg, creating a visual symmetry on the chart.
Importance in Trading
In the world of trading, the AB=CD pattern holds significant importance because of its predictive nature. It’s widely used by technical analysts and traders to identify potential reversal points in the market. These reversal points, marked by the completion of the CD leg, can signal either a bullish or bearish turn in price direction, depending on the orientation of the pattern. Traders value this pattern for its ability to offer clear entry and exit points, making it a powerful tool for planning trades.
Identifying the AB=CD Pattern
Description of the Four Legs: AB, BC, CD
The AB=CD pattern is composed of three distinct segments, forming four key points (A, B, C, and D) in its structure:
- AB Leg: This is the initial leg of the pattern, where the price moves in a particular direction, either up or down.
- BC Leg: Following the AB leg, the price retraces. This leg does not surpass the starting point of the AB leg and sets the stage for the next movement.
- CD Leg: The final leg, which is the price extension of the BC leg, and crucially, mirrors the AB leg in length and slope.
Characteristics of the Pattern
- Equal Length of AB and CD Legs: A hallmark of the AB=CD pattern is the symmetry between the AB and CD legs. Their lengths are ideally equal, or very close to equal, creating a sense of balance in the pattern.
- BC as a Retracement of AB: The BC leg represents a retracement of the initial AB leg. This retracement is typically a partial pullback rather than a full reversal of the initial price move.
- CD as the Price Extension of BC: The CD leg extends from the conclusion of the BC leg, moving in the same direction as the AB leg. It’s crucial that the CD leg mirrors the AB leg not just in length but also in its trajectory, completing the symmetrical nature of the pattern.
Trading the AB=CD Pattern
Entry Points
When trading the AB=CD pattern, the completion of the CD leg serves as a critical indicator for potential entry points. This completion point is where traders anticipate a reversal or continuation of the trend, making it an opportune moment to enter a trade.
Bullish AB=CD Pattern:
In a bullish pattern, where the price has been rising, the completion of the CD leg suggests the possibility of a continued upward trend or a reversal to a downtrend. Traders often enter a long position at this point.
Bearish AB=CD Pattern:
Conversely, in a bearish pattern with declining prices, the end of the CD leg may indicate a further drop or a reversal to an uptrend. This is where traders might consider entering a short position.
Stop Loss and Profit Targets
Setting stop loss and profit targets is crucial in managing risk and ensuring a disciplined approach to trading the AB=CD pattern.
- Stop Loss: A prudent place to set a stop loss is just beyond the completion point of the CD leg. This positioning helps protect against the risk of the pattern not behaving as anticipated and limits potential losses. For a bullish pattern, the stop loss is placed below the D point; for a bearish pattern, it’s set above the D point.
- Profit Targets: Profit targets are often based on key Fibonacci retracement levels associated with the AB leg. For instance, traders might set a profit target at the 61.8% or 78.6% retracement levels of the AB leg. These levels are chosen because the AB=CD pattern often coincides with Fibonacci ratios, making them reliable indicators of potential price reversal points.
Variations of the AB=CD Pattern
The AB=CD pattern manifests in two primary variations: bullish and bearish, each aligning with the overall trend direction of the market.
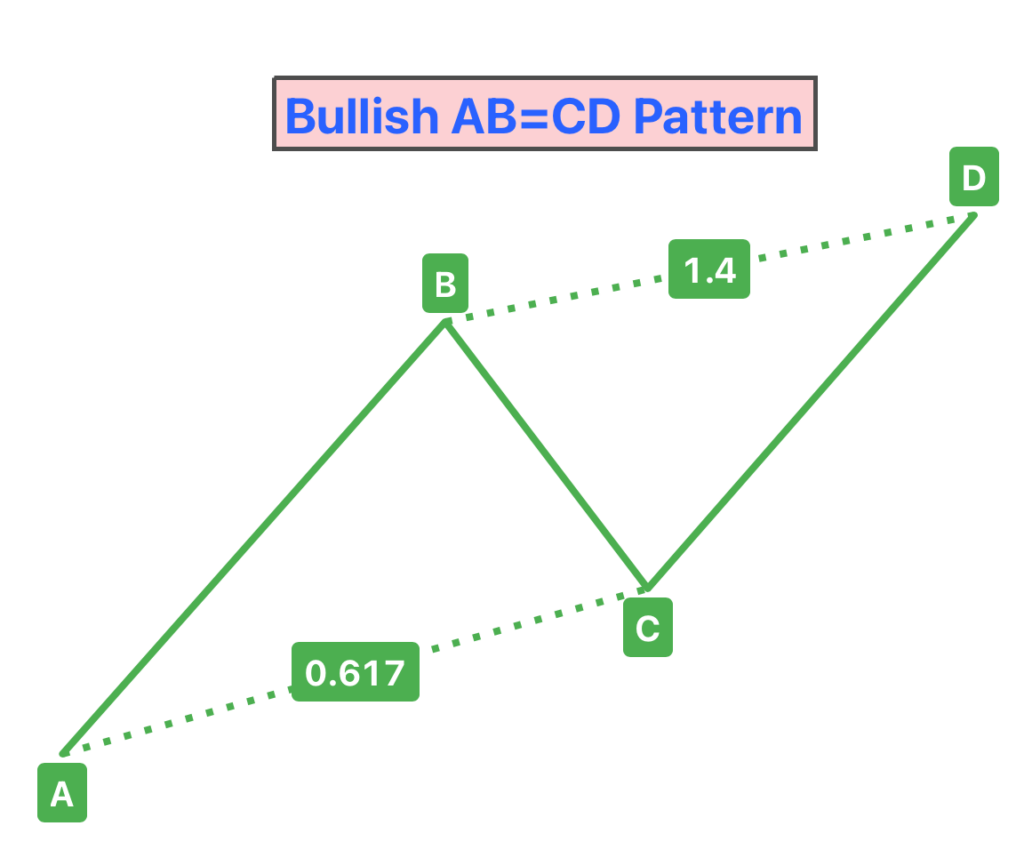
Bullish AB=CD Pattern
- Appearance in Uptrends: In a bullish variant, the AB=CD pattern forms during an uptrend. The initial leg AB is upward, followed by a retracement (BC), and then a final upward leg (CD) that mirrors the AB leg.
- Trading Implications: This pattern suggests that after a brief period of selling (BC leg), the buyers regain control and push the price back up (CD leg). Traders often look for the completion of the CD leg as a signal to enter long positions, anticipating a continuation of the uptrend.
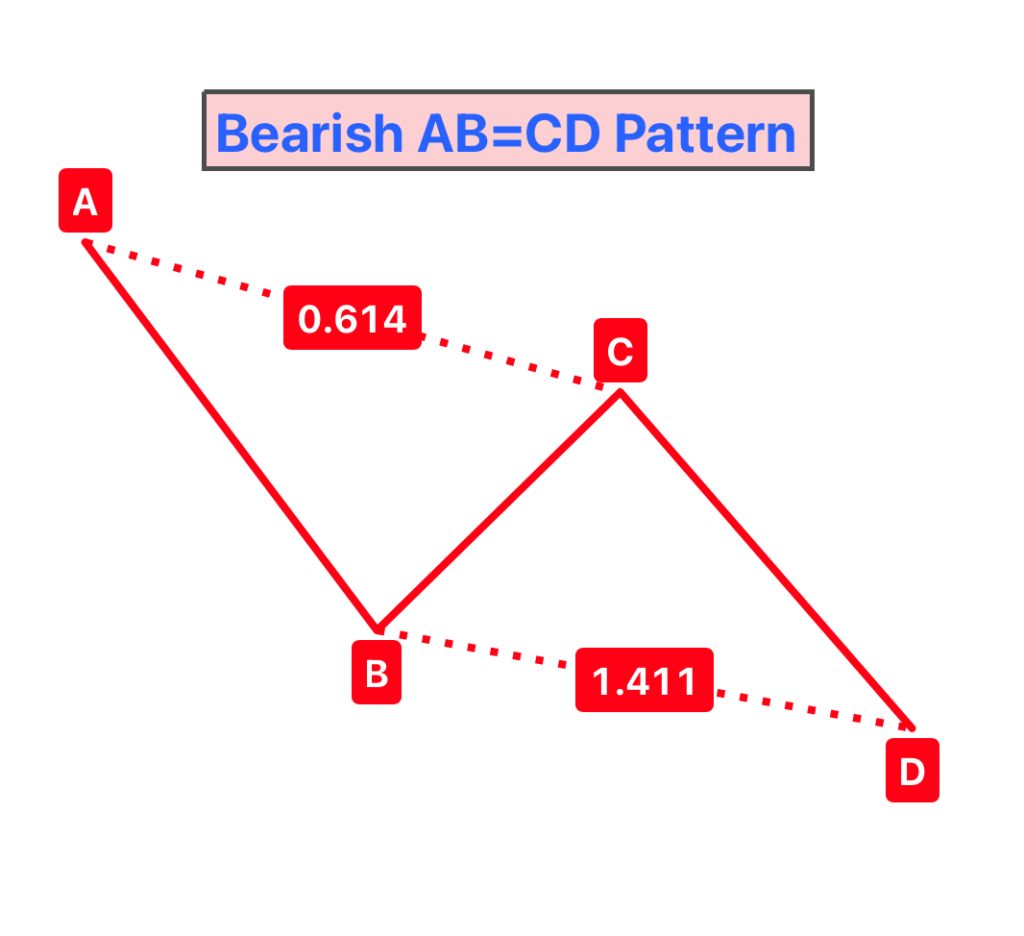
Bearish AB=CD Pattern
- Appearance in Downtrends: In the bearish version, the pattern is observed during a downtrend. Here, the AB leg moves downward, followed by a partial retracement (BC), and then another downward leg (CD) that resembles the AB leg.
- Trading Implications: This pattern indicates that the selling pressure is likely to resume after the temporary buying in the BC leg. The completion of the CD leg is often used as an indicator to enter short positions, expecting the downtrend to continue.
Both variants of the AB=CD pattern rely on the symmetry between the AB and CD legs, which is a key characteristic irrespective of the pattern being bullish or bearish.
Combining the AB=CD Pattern with Other Technical Tools
Confirmation Tools: Oscillators and Indicators
To increase the reliability of the AB=CD pattern, traders often combine it with other technical analysis tools. These tools provide additional confirmation and help in making more informed trading decisions.
- Oscillators: Tools like the Relative Strength Index (RSI) or Stochastic Oscillator can be used to identify overbought or oversold conditions. For instance, if the completion of the CD leg in a bullish AB=CD pattern coincides with an oversold reading on the RSI, it strengthens the case for a potential upward reversal.
- Indicators: Moving averages, Bollinger Bands, and MACD (Moving Average Convergence Divergence) are other popular indicators that can be used in conjunction with the AB=CD pattern. A bullish reversal signal from the AB=CD pattern that aligns with a bullish crossover in MACD can provide a stronger confirmation for entering a long position.
Support and Resistance: Aligning Pattern with Key Levels
Incorporating support and resistance levels can significantly enhance the effectiveness of the AB=CD pattern.
- Key Support and Resistance Levels: If the completion point of the CD leg aligns with a known support or resistance level, it adds credibility to the potential reversal signaled by the pattern. For example, in a bearish AB=CD pattern, if the D point is near a strong resistance level, it could indicate a higher probability of price reversal from this point.
- Historical Price Levels: Using historical price data to identify significant levels where the asset has previously encountered buying or selling pressure can also help in validating the AB=CD pattern. A convergence of these levels with the pattern completion point may suggest a stronger trade setup.
Conclusion
In summary, the AB=CD pattern is a highly regarded and effective tool in trading. Its simplicity allows traders of all levels to easily recognize and utilize it across various markets and timeframes. By providing clear indications of potential price reversals, it helps traders in making informed decisions about entry and exit points. When combined with other technical analysis tools, its effectiveness is further enhanced, making it a valuable component of any trader’s strategy.

