Definition
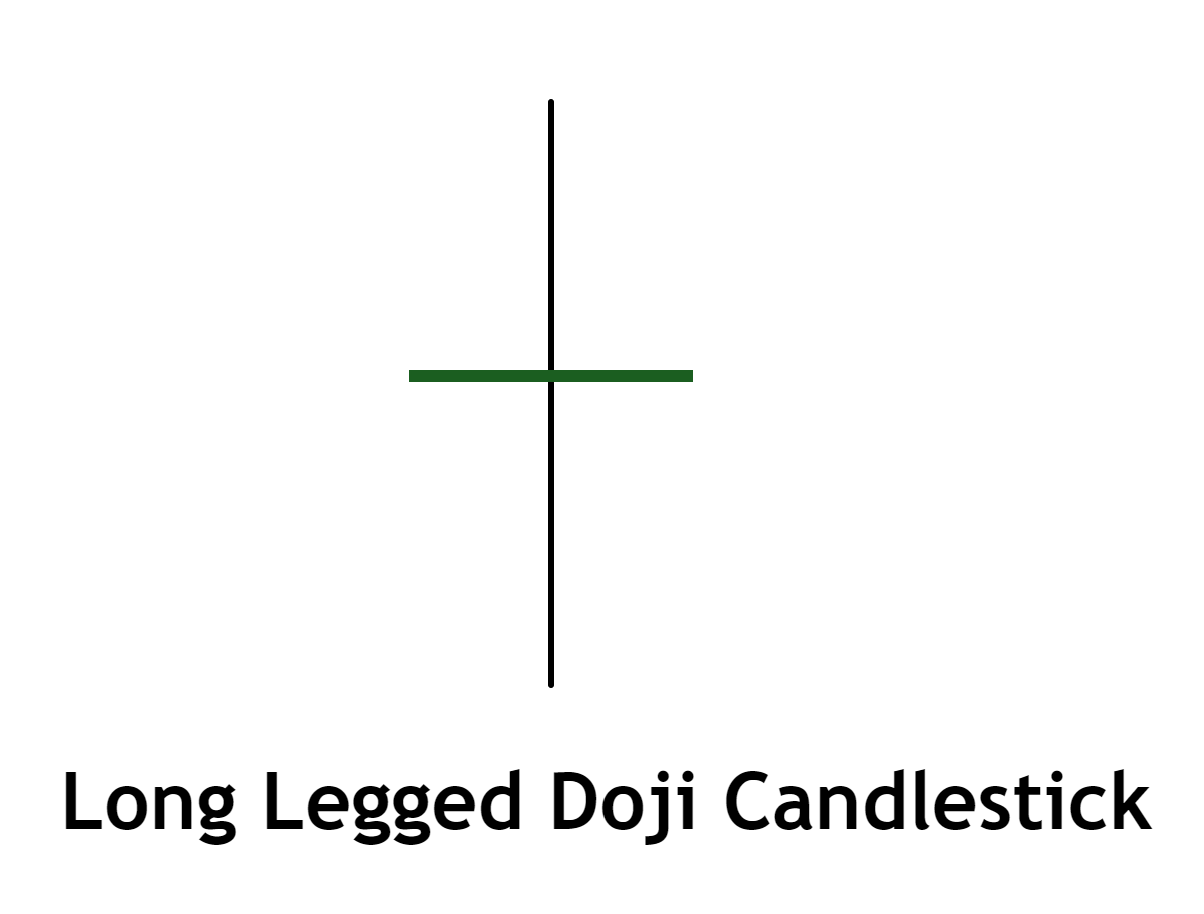
The Long-Legged Doji Candlestick Pattern is a single candlestick pattern characterized by long upper and lower shadows and virtually the same opening and closing prices, reflecting a state of indecision and significant volatility in the market.
This Pattern illustrates a trading session in which the market explored both higher and lower prices, but closed near where it opened, indicating a tug-of-war between buyers and sellers with no clear winner.
Identifying the Long-Legged Doji Candlestick Pattern on a Chart
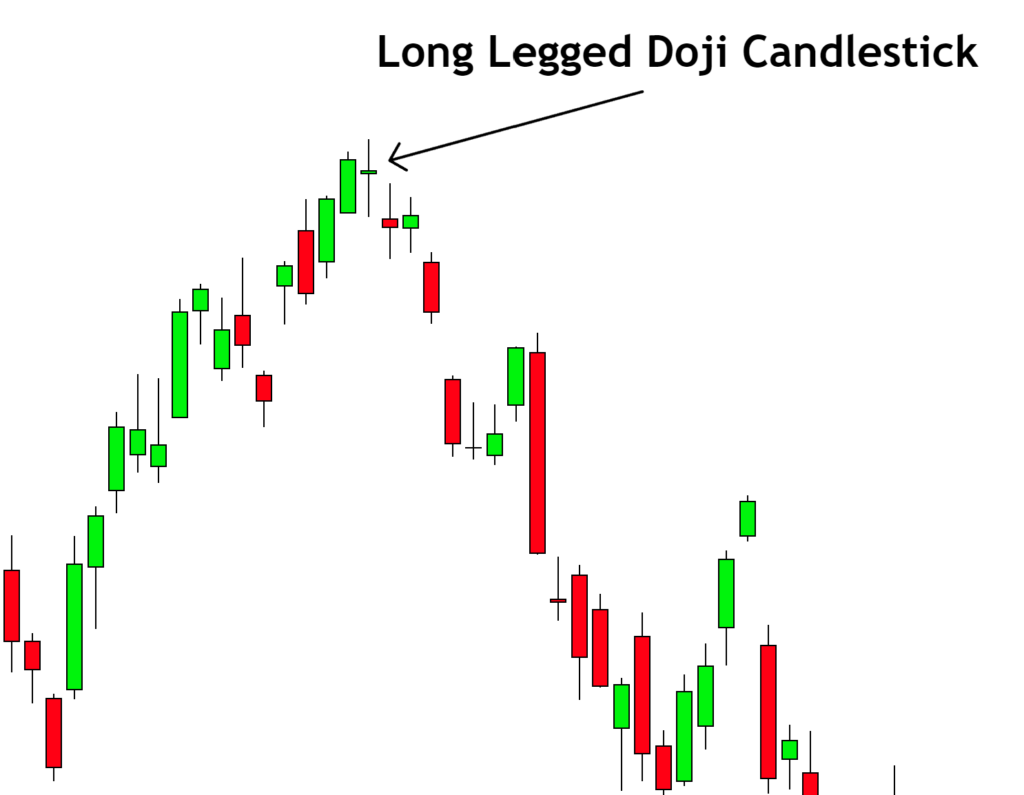
Spotting a Long-Legged Doji on a chart is straightforward once you know the characteristics. Here are the key points to consider:
- Single Candlestick: The Long-Legged Doji is a single candlestick pattern. There are no prerequisites regarding the preceding candles.
- Long Shadows: Look for a candlestick with noticeably long upper and lower shadows. These shadows should be roughly equal in length, demonstrating that the market explored higher and lower prices during the trading session.
- Small Body: The body of the candlestick, the part between the opening and closing prices, should be very small, almost a line. In fact, in a perfect Long-Legged Doji, the opening and closing prices are identical, creating a cross or plus sign appearance.
- Placement in Trend: While this pattern can appear anywhere, its significance is heightened when it occurs after a long uptrend or downtrend, indicating a potential upcoming change in the market direction.
By recognizing these characteristics, traders can effectively identify the Long-Legged Doji pattern on a chart.
Significance and Market Implications
The Long-Legged Doji, with its striking visual appearance, carries significant implications for traders:
- Market Indecision: The pattern signifies a state of indecision in the market, with neither buyers nor sellers gaining control. This often suggests a potential change in market sentiment.
- Volatility: The long shadows indicate significant price movement in both directions during the trading session, pointing to heightened market volatility.
- Potential Reversal: If the Long-Legged Doji appears after a prolonged uptrend or downtrend, it can be an early warning of a potential trend reversal. However, it’s crucial to wait for subsequent confirmation before acting on this signal.
- Psychological Insight: The Long-Legged Doji provides valuable insight into the psychological dynamics of the market. The tug-of-war between buyers and sellers, represented by the long shadows and close near the opening price, mirrors the uncertainty in the market.
Big Traders’ Activity During the Formation of the Long-Legged Doji
The formation of a Long-Legged Doji can tell us a lot about the activity of large players or institutions in the market:
- Price Exploration: The long shadows indicate that big traders have tested both higher and lower price levels during the session. However, they couldn’t sustain the price at those levels, resulting in a close near the opening price.
- Liquidity Hunting: Sometimes, large traders drive prices up or down to trigger stop losses or to fill large orders at better prices. The long wicks of the Doji can be an outcome of such liquidity hunting.
- Potential Positioning: The indecision shown by a Long-Legged Doji can suggest that big traders are unsure about the direction of the market and may be adjusting their positions accordingly. This could potentially lead to a reversal or continuation based on subsequent candles.
- Indecision: The formation of a Long-Legged Doji is an indication that neither the bulls nor the bears could gain the upper hand. This can be a result of major market players having diverging views on the market direction.
Retail traders should be cautious when a Long-Legged Doji forms, as it suggests heightened uncertainty and potential volatility.
Confirmation Tools
To increase the accuracy of trading signals given by the Long-Legged Doji, it’s recommended to seek additional confirmation from other technical tools. Here are four useful tools for this purpose:
- Key Levels: Look for the Long-Legged Doji forming near key levels of support or resistance. These are price levels where the market has shown a strong reaction in the past, strengthening the possibility of a reversal.
- Volume: Pay attention to trading volume. High volume during the formation of the Long-Legged Doji can underscore the struggle between buyers and sellers, adding weight to the pattern.
- Break of High or Low: A break of the high or low of the Doji in the subsequent candle can give a directional bias. For instance, if the next candle breaks the low of the Doji, it may indicate that sellers are taking control, signaling a potential bearish reversal.
- Technical Indicators: Use indicators such as Moving Averages, RSI, or MACD to confirm the potential trend reversal or continuation. For instance, an overbought RSI level coupled with a Long-Legged Doji at resistance can suggest a high probability bearish reversal.
By using these confirmation tools in conjunction with the Long-Legged Doji, traders can filter out false signals and improve their trading accuracy.
Trading the Long-Legged Doji: Timeframe, Session, and Winning Ratio
- Best Timeframe: The Long-Legged Doji can appear in any timeframe, but its reliability increases with the timeframe. Daily and weekly charts provide a more significant snapshot of trader sentiment, making these timeframes particularly effective for spotting this pattern.
- Trading Session: This pattern is universal and can be traded in any session – be it the US, European, or Asian sessions. However, it may hold more significance if it forms during the session which typically sees the highest volume for the particular instrument you’re trading.
- Approximate Winning Ratio: While the exact winning ratio can vary based on many factors like the market, timeframe, and the trader’s skill, a well-executed Long-Legged Doji strategy can potentially offer a winning ratio around 55-65%.
Trading Strategy with Long-Legged Doji and Confluence
To trade the Long-Legged Doji effectively, consider using a strategy that adds confluence. Here is a simple yet effective approach:
- Identify the Pattern: Wait for a Long-Legged Doji to form at a significant level of support or resistance. This adds a layer of confluence to your trading setup.
- Confirmation: Look for a subsequent candle that confirms the reversal. If the pattern formed at resistance, a bearish candle breaking the low of the Doji can be a trigger. If it formed at support, a bullish candle breaking the high can be your entry signal.
- Entry Point: Enter the trade at the break of the Long-Legged Doji’s high/low, as confirmed by the subsequent candle.
- Stop Loss: Set your stop loss above the high (for a sell setup) or below the low (for a buy setup) of the Long-Legged Doji. This protects you in case the market goes against your position.
- Take Profit: Your take profit can be set at the next significant support or resistance level, or you can use a risk to reward ratio, such as 1:2 or 1:3, depending on your trading style.
Conclusion
The Long-Legged Doji is a powerful candlestick pattern that reflects indecision and potential reversals in the market. However, it’s crucial to remember that no pattern works 100% of the time. Always use a combination of tools for confirmation and employ sound risk management to ensure your trading strategy’s success.

