Definition
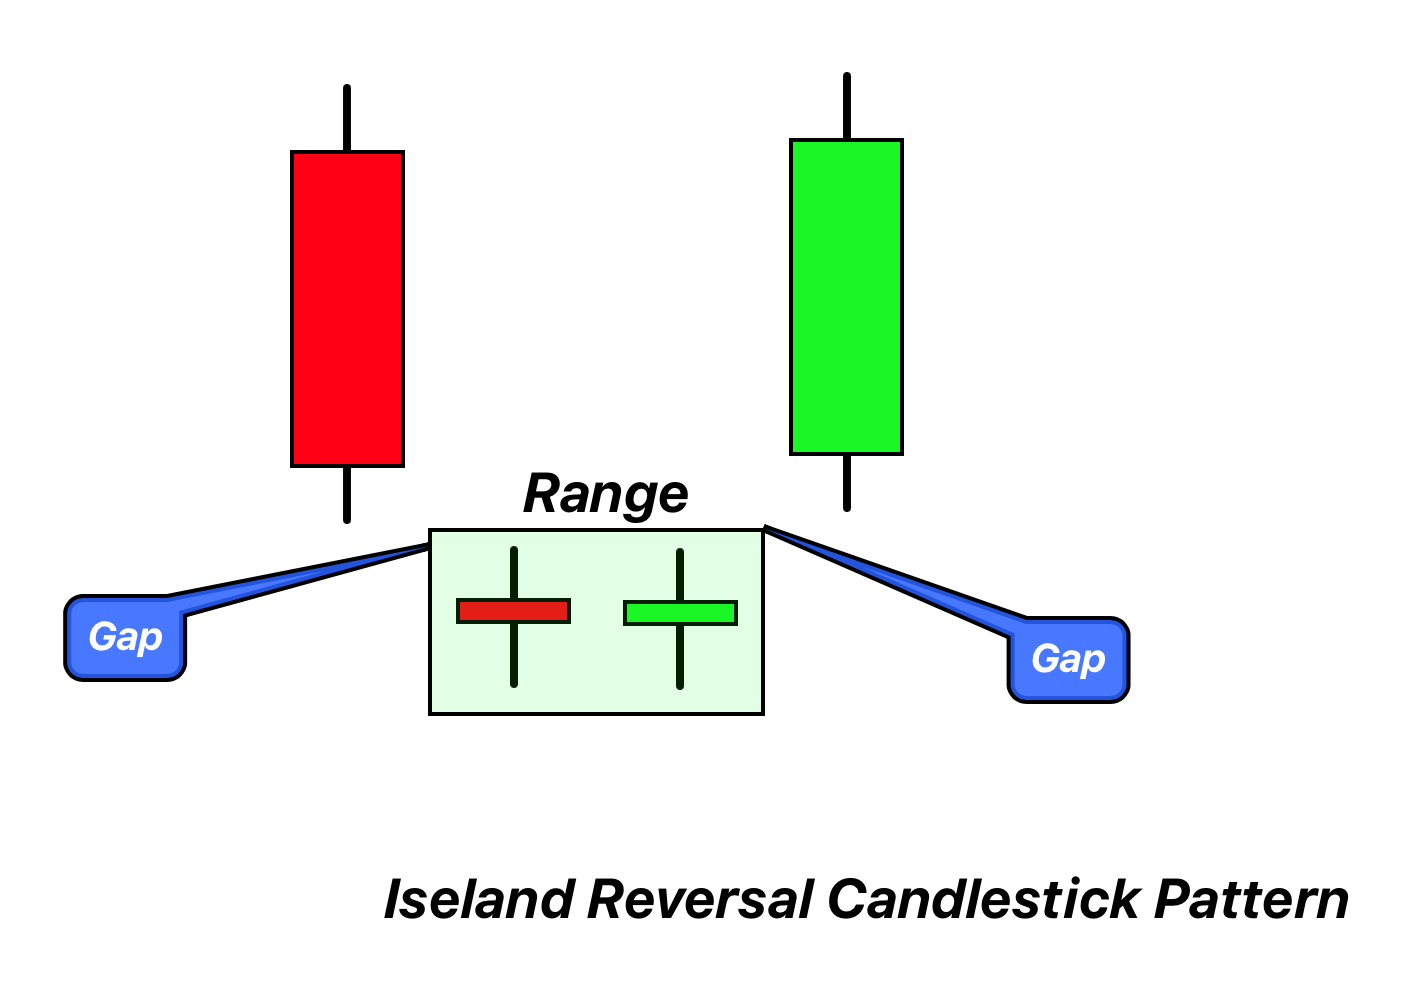
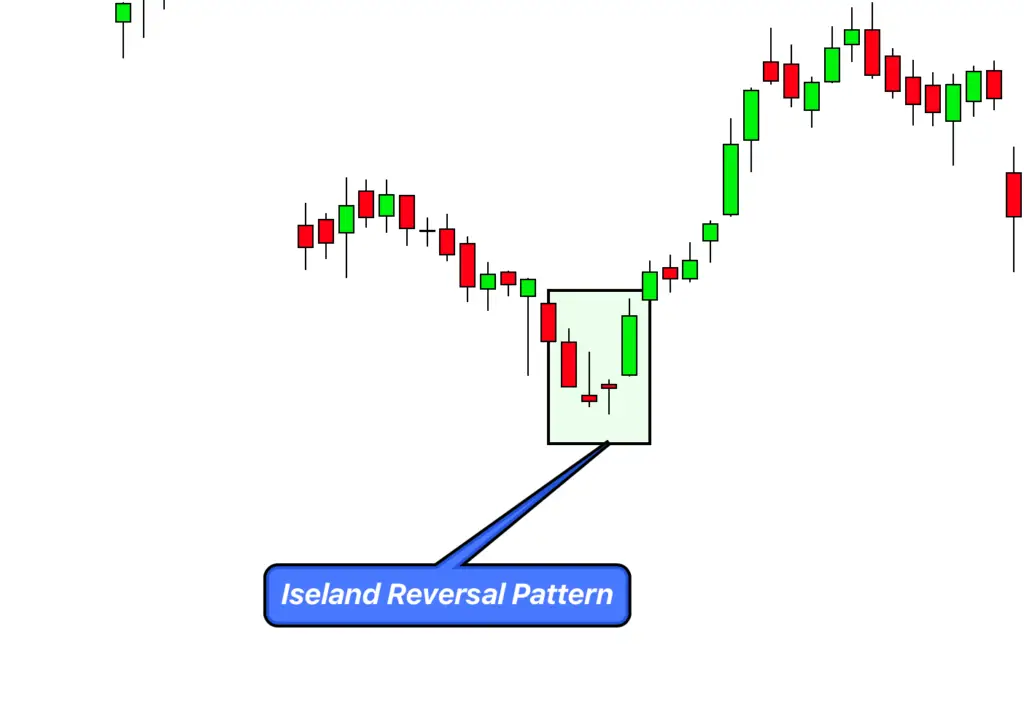
Island Reversal is a reversal candlestick pattern that consists of a gap in the price movement, followed by a consolidation, and then another gap in the opposite direction, forming an ‘island’ of prices detached from the rest of the price trend.
In the financial markets, the Island Reversal pattern is a powerful tool used by professional traders to detect potential reversals, signifying a sudden shift in market sentiment.
Identifying the Island Reversal Candlestick Pattern
- Market Trend: Look for an existing trend either upward or downward. An Island Reversal can signal a reversal for both.
- Initial Gap: Notice a gap in price movement, where no trading activity took place, extending the current trend. In an uptrend, this would be a gap up, and in a downtrend, a gap down.
- Formation of the Island: After the gap, the price action starts to trade in a range forming a consolidation, which is the ‘island’. The candles in this area can be of any size or shape, but they’re typically isolated by gaps on both sides.
- Second Gap: Look for another gap in the opposite direction of the initial gap. This second gap is the key as it separates the island from the ongoing price action, marking the potential end of the current trend.
- Confirmation: Confirm the pattern with a candle following the second gap that continues in the direction of the reversal. This usually indicates that the sentiment has shifted, and the prior trend is likely to reverse.
The Significance and Implications of the Island Reversal Candlestick Pattern
The Island Reversal pattern holds considerable importance in trading due to its rarity and potential predictive power. It signifies a dramatic shift in market sentiment, implying a strong reversal in the price trend.
- Psychological Shift: This pattern indicates a sudden and significant shift in trader psychology from bullish to bearish or vice versa, illustrating a change in supply and demand dynamics.
- Powerful Reversal Signal: Due to its unique structure with gaps on both sides of the ‘island’, it provides a strong reversal signal. This pattern is more reliable than many other single candle reversal patterns.
- Profitable Exit and Entry Points: For traders, spotting an Island Reversal can offer profitable exit points from current positions and attractive entry points for new positions. If the pattern forms after a significant uptrend, it could be a good time to sell or go short, and if it forms after a downtrend, it might be a buying opportunity.
- Importance of Volume: For increased confidence, traders often look for high trading volume on the days of the gap formations and decreased volume during the formation of the ‘island’. This volume pattern can provide additional confirmation of the island reversal.
- Validation through Other Indicators: Like all candlestick patterns, the Island Reversal should be used in conjunction with other technical analysis tools to confirm signals and avoid potential false positives. The use of trend lines, support and resistance levels, and technical indicators can help to increase the likelihood of a successful trade.
Big Traders’ Activity During the Formation of an Island Reversal Candlestick Pattern
When an Island Reversal pattern appears, it often indicates notable activity by big traders or institutions in the market. Here’s what typically occurs:
- Initial Trend and Gap: In the existing market trend, whether bullish or bearish, big traders are heavily involved, driving the price and creating the first gap. Their significant buying or selling activities cause the price to gap up or down.
- Island Formation: During the formation of the ‘island’, big traders may start reevaluating their positions. They might reduce their activity, which leads to a consolidation phase as the price starts to range. This period often corresponds to decreased trading volumes, indicating lesser involvement by big traders.
- Second Gap and Reversal: The second gap, marking the reversal, typically indicates that big traders have decided to change their positions dramatically. If the initial trend was upward, they might start selling off their holdings, causing the price to gap down. If the trend was downward, they might start buying, leading to a gap up. This shift in positions often happens with increased volume, signaling the involvement of big traders.
- Post-Reversal Activity: After the Island Reversal, big traders continue trading in the direction of the new trend, further confirming the pattern and potentially driving the price trend in the new direction.
For retail traders, understanding this activity can be crucial. When they recognize an Island Reversal pattern, they can anticipate a potential shift in big traders’ sentiment and align their trading strategies accordingly.
Confirmation Tools for Island Reversal Candlestick Pattern
Using various tools and indicators can increase the probability of successfully identifying and trading the Island Reversal pattern. Here are four effective tools for confirmation:
- Key Level Break: After the pattern formation, look for the price to break a significant support or resistance level. For instance, in a bullish Island Reversal, a break above a major resistance level can confirm the reversal. In a bearish Island Reversal, a break below a crucial support level can signal a valid downtrend.
- Trading Volume: High trading volume on the gap days can confirm the intensity of the sentiment shift, and reduced volume during the island formation can indicate a pause in the trend. A sudden increase in volume after the second gap in the direction of the reversal can further validate the pattern.
- Momentum Indicators: Use momentum indicators like the Relative Strength Index (RSI) or Moving Average Convergence Divergence (MACD) to confirm the trend reversal. For instance, in a bullish reversal, RSI moving above 50 or a bullish MACD crossover can confirm the pattern.
- Candlestick Confirmation: After the formation of the second gap, look for a strong candlestick in the direction of the reversal. For example, a bullish engulfing candle after a bearish Island Reversal or a bearish engulfing candle after a bullish Island Reversal can provide further confirmation of the pattern.
Optimal Conditions for Island Reversal Candlestick Pattern
Best Timeframe: The Island Reversal pattern can be identified across various timeframes, but it tends to be most reliable on the daily and weekly charts. Larger timeframes help filter out market ‘noise’ and often result in more significant trend reversals.
Trading Session: The Island Reversal pattern is applicable across all trading sessions. However, it is particularly effective during the market open and close when the likelihood of gapping price action is higher due to overnight or weekend news events.
Winning Ratio: While the exact winning ratio can vary based on the overall market conditions and individual trading strategies, with proper confirmation tools and prudent risk management, traders can aim for a winning ratio of around 60-70%.
Trading Strategy with Confluence for Island Reversal Candlestick Pattern
Entry: Once an Island Reversal pattern is identified, and other confirmation tools align, initiate a trade in the direction of the expected reversal. In a bullish reversal, enter a long position after the second gap up. In a bearish reversal, enter a short position after the second gap down. Ensure the pattern’s validation with a candle in the direction of the reversal and the confirmation of other technical indicators.
Stop Loss: Set a stop loss just outside the ‘island’ of the pattern. This means, for a bullish reversal, the stop loss would be slightly below the lowest low of the island, and for a bearish reversal, it would be just above the highest high of the island. This approach protects your capital if the pattern turns out to be a false signal.
Take Profit: Set the initial take profit target at a distance equal to the size of the ‘island’ or the largest gap. However, depending on other market factors and the strength of the new trend, consider trailing your stop loss to secure more profit.
Conclusion
The Island Reversal is a powerful and reliable candlestick pattern indicating a significant trend reversal. Though rare, when it appears with the right confirmation tools, it offers excellent trading opportunities. However, like all trading strategies, it’s not foolproof and must be used with proper risk management techniques to protect against potential losses. It’s recommended to practice on a demo account and gain familiarity with this pattern before using it in live trading.

