Definition
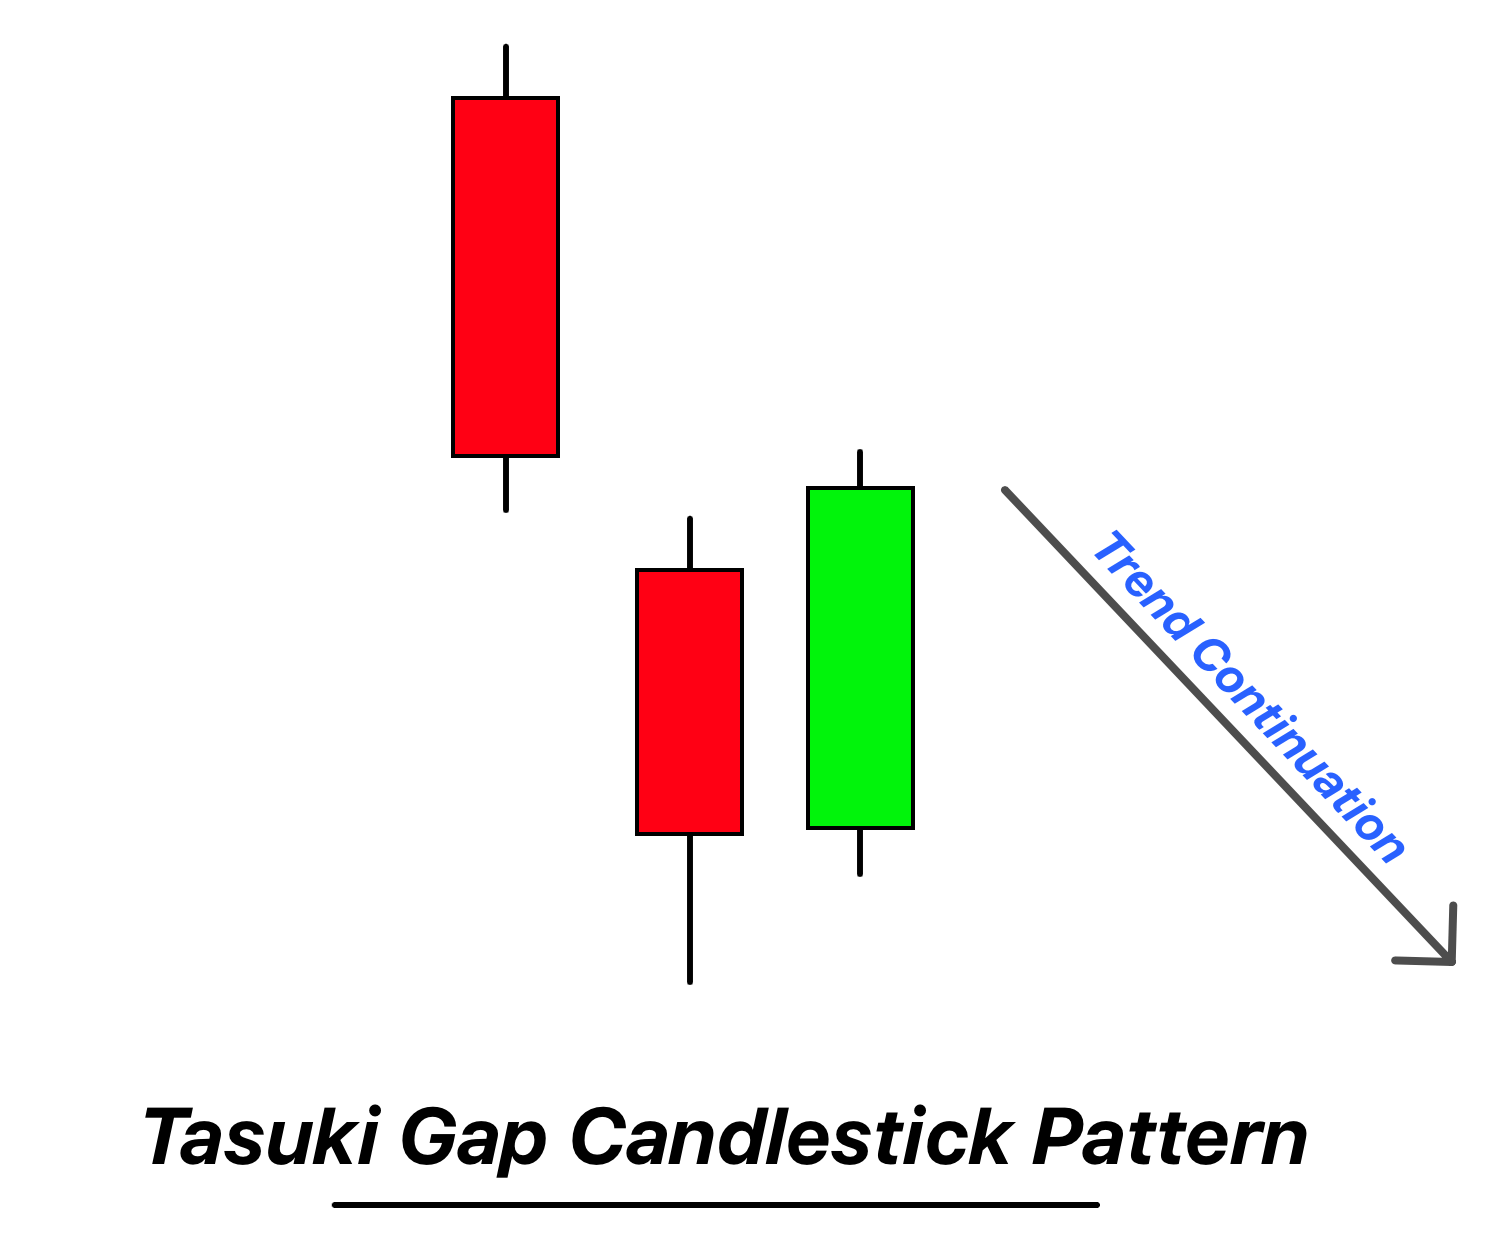
The Tasuki Gap is a three-candle continuation pattern that starts with a gap in the direction of the prevailing trend, followed by a candle that gaps in the opposite direction but doesn’t fully close the initial gap.
In the context of a trend, the Tasuki Gap indicates a momentary pause and potential continuation of the prevailing trend after a brief counter-trend movement.
How to Identify the Tasuki Gap Candlestick Pattern on a Chart
- Prevailing Trend: The pattern should emerge within a clear trend, either bullish or bearish. This context is essential, as the Tasuki Gap is a continuation pattern.
- First Candle:
- In an uptrend: It should be a bullish candle with a noticeable body, confirming the ongoing uptrend.
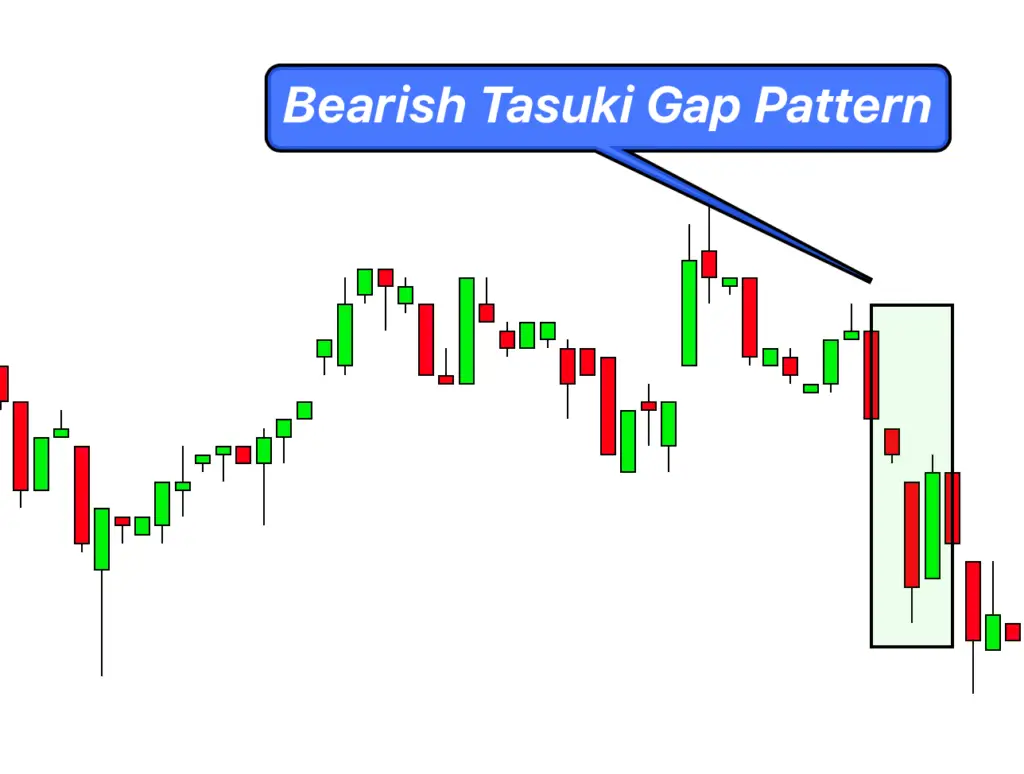
- In a downtrend: It should be a bearish candle with a noticeable body, confirming the ongoing downtrend.
- Gap Formation:
- The next candle should gap in the direction of the prevailing trend.
- In an uptrend: This would be another bullish candle that opens above the close of the first candle.
- In a downtrend: This would be another bearish candle that opens below the close of the first candle.
- The next candle should gap in the direction of the prevailing trend.
- Third Candle:
- This candle should gap in the opposite direction of the prevailing trend and the second candle.
- Importantly, this third candle should not close the gap created by the second candle.
- In an uptrend: This means a bearish candle that opens below the close of the second candle but doesn’t close below the open of the second candle.
- In a downtrend: This means a bullish candle that opens above the close of the second candle but doesn’t close above the open of the second candle.
- Candle Sizes: While not mandatory, the three candles typically have similar body sizes, providing a more symmetrical look to the pattern.
Significance and Indications
1. Trend Continuation Confirmation: At its core, the Tasuki Gap signals the likelihood of the prevailing trend continuing. After the brief counter-trend gap (represented by the third candle), the market often resumes the direction of the initial trend, indicating the pause was temporary.
2. Temporary Exhaustion: The third candle, which moves counter to the trend, indicates a momentary exhaustion of the prevailing trend. However, since this candle doesn’t close the gap formed by the second candle, it suggests the counter-trend movement is likely short-lived.
3. Psychological Underpinning: The pattern can be interpreted as a battle between bulls and bears (or vice versa depending on the trend). The initial trend sees a burst of momentum (first two candles), then a brief counter-move by the opposing side (third candle). However, their failure to close the gap indicates the prevailing trend’s strength and potential continuation.
Activity of Big Traders During the Formation of the Tasuki Gap Pattern
1. Momentum Commitment: The formation of the initial gap (by the second candle) in the direction of the prevailing trend suggests that institutional traders are amplifying their positions, either adding to their longs in an uptrend or their shorts in a downtrend. This propels the momentum further.
2. Brief Counter-Trend Movement: The third candle, moving against the trend, can be seen as minor profit-taking by these institutional players or a small influx of counter-trend traders attempting to capitalize on a perceived overextension.
3. Incomplete Reversal: The fact that the third candle doesn’t close the gap indicates that while there was a brief opposing force (either profit-taking or counter-trend trading), it wasn’t strong enough to outweigh the main trend. This can be interpreted as the dominant institutional traders maintaining their positions or new big players entering in favor of the prevailing trend.
5. Order Flow: For traders with access to order flow data, observing large orders around the gap can offer direct insights. The presence of significant buy orders (in an uptrend) or sell orders (in a downtrend) around the gap region indicates institutional interest and the potential for the prevailing trend to continue.
Optimal Trading Conditions
Best Timeframe: The Daily and 4-hour charts are preferable for spotting the Tasuki Gap, as these timeframes offer clearer visuals of the pattern and reduce the noise of lower timeframes.
Trading Session: The pattern’s reliability increases when it forms during major market sessions like the London or New York sessions. This is due to higher liquidity and the active participation of institutional players during these periods.
Winning Ratio: With the right context and confluence factors, the Tasuki Gap can offer a winning ratio of approximately 58-62%. However, individual results might vary based on market conditions and the trader’s ability to interpret other supporting factors.
Tasuki Gap Pattern Trading Strategy with Confluence
Confluence Factors to Consider:
- Support/Resistance Levels: The pattern’s effectiveness increases when it forms near major support or resistance zones.
- Technical Indicators: Indicators such as the RSI or MACD can be helpful. For instance, bullish divergence in a bearish Tasuki Gap can hint at a stronger bullish reversal.
- Volume Analysis: A spike in volume on the first two candles, followed by decreased volume on the counter-trend third candle, further solidifies the pattern’s validity.
Entry:
- After observing the Tasuki Gap pattern and considering the above confluence factors, enter the trade in the direction of the prevailing trend following the close of the third candle.
Stop Loss:
- Place the stop loss just beyond the extreme of the third candle. In a bullish Tasuki Gap, this would be just below the low of the third candle. Conversely, in a bearish Tasuki Gap, set the stop loss just above the high of the third candle.
Take Profit:
- A conservative target is to aim for a 1:2 or 1:3 risk-to-reward ratio based on the distance from the entry point to the stop loss.
- For more advanced targeting, consider aiming for the next significant resistance (in an uptrend) or support (in a downtrend) level.
Conclusion
The Tasuki Gap pattern is a reliable continuation signal when identified correctly, especially in conjunction with confluence factors. It not only offers traders insights into the market’s potential next moves but also provides clear entry, stop, and target levels. Like all trading patterns, it’s essential to approach it with discipline, proper risk management, and in the context of the broader market scenario.

