Definition:
Cradle Candlestick Pattern is a bullish reversal formation characterized by a smaller red candle followed by a larger green candle, both fitting within the range of a preceding downtrend. A beacon of hope for buyers, the Cradle Candlestick Pattern often indicates the potential start of an upward momentum after a prior decline.
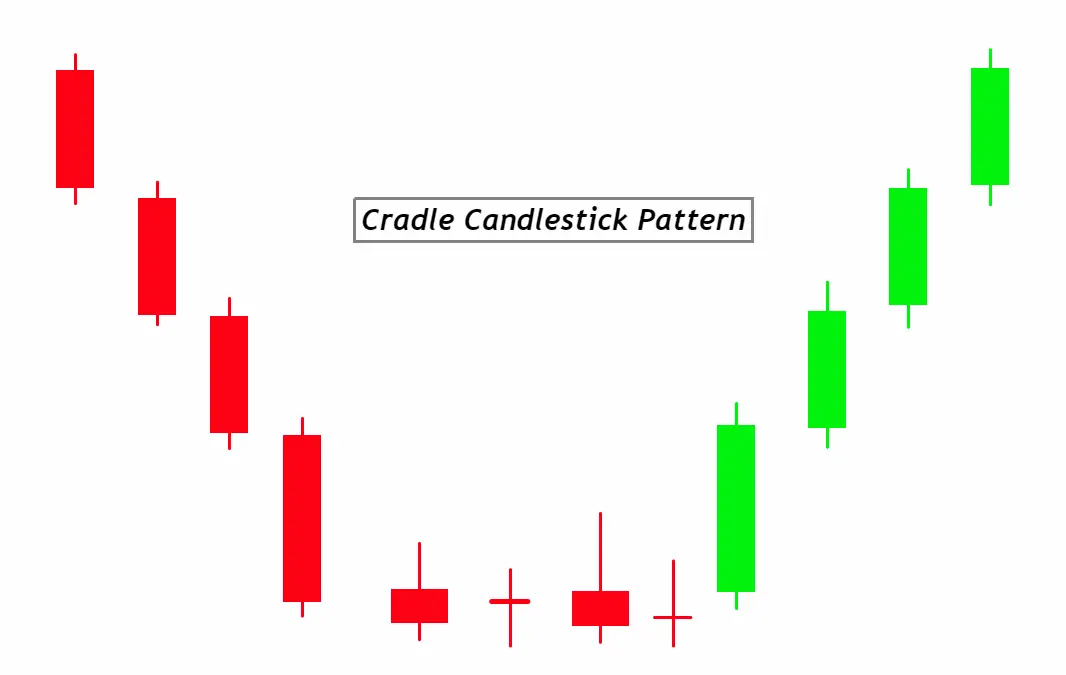
How to Identify the Cradle Candlestick Pattern on the Chart:
- Trend Precedence: Begin by identifying a clear downtrend. This pattern typically emerges after a series of declining candles.
- First Candle: The first candle in the pattern should be a red (or black, depending on the chart) candle, indicating a continuation of the downtrend.
- Second Candle: Look for a green (or white) candle that follows the red candle. This green candle signals the potential reversal.
- Candle Size: The green candle should be larger than the preceding red candle but not excessively larger. It indicates that buyers are stepping in with greater force than the sellers of the previous day.
- Range Containment: Both the red and green candles should fit within the range of one or more of the preceding candles, forming a ‘cradle’. This means the high of the green candle shouldn’t exceed the high of the previous candle(s), and the low shouldn’t fall below the low of the previous candle(s).
- Volume Consideration (Optional but helpful): A spike in trading volume on the day of the green candle can further validate the pattern’s strength and the likelihood of a trend reversal.
- Confirmation: While the cradle pattern alone can suggest a reversal, many traders wait for further confirmation, like another bullish candle or technical indicator, before making a trading decision.
By focusing on these points, traders can effectively spot the Cradle Candlestick Pattern on the chart, signaling potential bullish reversals.
Significance and Indications of the Cradle Candlestick Pattern:
1. Trend Reversal Indicator: The Cradle Candlestick Pattern is primarily revered for its ability to signal a potential change in market direction. After a consistent downtrend, this pattern’s appearance can be an early hint to traders that the selling momentum is waning and a bullish sentiment may be on the horizon. It’s a pattern that essentially tells traders, “The bears are losing their grip, and the bulls might just be taking over.”
2. Risk Management Tool: For traders, it’s not just about predicting where the market will go, but also about managing risk. The clearly defined structure of the cradle pattern gives traders a tangible point of reference. If a trader chooses to enter a long position upon seeing this pattern, they can place a stop-loss below the low of the pattern, ensuring they have a clear exit strategy if the anticipated bullish reversal doesn’t materialize.
3. Strength in Confirmation: While the Cradle Candlestick Pattern can be a strong indication on its own, its true power often comes when paired with other technical analysis tools. For instance, if this pattern emerges near a significant support level or coincides with a bullish divergence on an oscillator like the RSI, its predictive power can increase manifold. By using the cradle pattern in conjunction with other tools, traders can boost their confidence in the potential reversal.
4. Psychological Insight: At its core, candlestick patterns like the cradle provide a glimpse into the market’s collective psychology. The cradle pattern specifically shows a shift from fear and selling to optimism and buying. Recognizing this change in sentiment can give traders an edge, allowing them to align their strategies with the broader market mood.
In essence, the Cradle Candlestick Pattern serves as a valuable tool in a trader’s arsenal, offering both predictive insights and a framework for strategic decision-making.
Activity of Big Traders During the Formation of the Cradle Candlestick Pattern:
1. Distribution and Accumulation: Often, the initial downtrend before the cradle pattern can be the result of larger players (often called “smart money” or “institutional investors”) distributing or offloading their positions. As prices lower, these big traders start accumulating, believing the asset to be undervalued. The cradle pattern’s first red candle might represent the tail end of distribution, while the subsequent green candle can signify the beginning of quiet accumulation by these major players.
2. Volume Analysis: A discernible increase in volume during the formation of the green candle in the cradle pattern can indicate active participation by institutional traders. Big traders have the capacity to move markets due to the sheer size of their orders. If there’s a noticeable surge in volume as the green candle forms, it can suggest that larger entities are stepping in, buying, and thereby supporting the potential reversal.
3. Order Flow and Stop Hunts: Big traders are always on the lookout for optimal entry points, and they’re aware that many retail traders might place their stop-loss orders just below the recent lows. If there’s a brief downward spike before the green candle’s formation (trying to touch or breach the low of the previous red candle), it could be indicative of “stop hunts.” These are intentional moves by bigger players to trigger the stop-loss orders of retail traders, allowing the big traders to absorb those sell orders and buy at a better price before pushing the market up.
4. Price Levels and Support Zones: Institutional players tend to place significant importance on key price levels, such as historical support and resistance or Fibonacci retracement levels. If the cradle pattern forms around these strategic zones, it’s a strong indication that the big traders are seeing value and potentially positioning themselves for a bullish move.
In summary, behind the seemingly simple structure of the cradle pattern lies a complex interplay of actions and intentions by the market’s biggest players. For retail traders, understanding this deeper narrative can provide invaluable context, helping them trade more in sync with the market’s major forces and improve their forecasting accuracy.
Confirmation Tools for the Cradle Candlestick Pattern:
| Tool | Description |
|---|---|
| Key Levels (Support/Resistance) | The formation of the cradle pattern near historical support or resistance levels can enhance its validity. If the pattern appears near a key level, it suggests that the level is being respected and could act as a strong base for a potential reversal. |
| Break of Low After Pattern Formation | If the price fails to break below the low of the cradle pattern post-formation, it acts as a bullish confirmation. It indicates that the buying momentum is holding strong and a potential reversal is more likely. |
| High Volume | An increase in volume, especially during the formation of the green candle, suggests active participation by larger players. High volume lends credibility to the pattern, indicating a stronger commitment from buyers. |
| Technical Indicators (e.g., RSI, MACD) | Bullish divergences on oscillators like RSI or MACD, when aligned with the cradle pattern, provide a stronger case for a potential reversal. For instance, if the price makes a lower low but the RSI makes a higher low, it indicates weakening downward momentum. |
By cross-referencing the Cradle Candlestick Pattern with these confirmation tools, traders can heighten their probability of success and make more informed decisions in the market.
Optimal Trading Parameters for the Cradle Candlestick Pattern:
Best Timeframe: The Cradle Candlestick Pattern can be effectively applied across various timeframes, but it often shines on the daily and 4-hour charts. These timeframes offer a balance between clear signals and manageable trade durations.
Trading Session: For currency and stock traders, focusing on the overlap of the London and New York sessions (8:00 AM to 12:00 PM EST) can be advantageous. This period typically sees higher liquidity and increased price movements, aligning well with the pattern’s characteristics.
Approximate Winning Ratio: While individual results can vary based on market conditions and trader skill, a well-confirmed Cradle Candlestick Pattern can often yield a winning ratio of around 60-70%. Remember, risk management remains crucial for overall trading success, even with a high-probability pattern like this.
Trading Strategy with Confluence Using the Cradle Candlestick Pattern:
Entry: Look for the Cradle Candlestick Pattern on the daily chart, focusing on currency pairs or stocks. Confirm the pattern’s validity by checking for confluence with key support or resistance levels. Once the pattern forms, enter a long position at the opening price of the candle following the green (bullish) cradle candle, provided the price doesn’t breach the low of the pattern.
Stop Loss: Place a stop-loss order just below the low of the green cradle candle. This level acts as a safeguard, helping to limit potential losses if the reversal doesn’t materialize as expected.
Take Profit: Set a take-profit level based on the height of the pattern or in confluence with a significant resistance level. This provides a clear target for exiting the trade when the bullish momentum is likely to stall.
Conclusion:
The Cradle Candlestick Pattern, when used in conjunction with confluence factors such as key support/resistance levels and technical indicators, can be a powerful tool for traders seeking high-probability reversal setups. While it doesn’t guarantee success in every instance, it provides a structured approach to identifying potential trend changes and managing risk effectively, making it a valuable addition to a trader’s toolkit. Remember that proper risk management remains crucial to long-term trading success.

