Definition
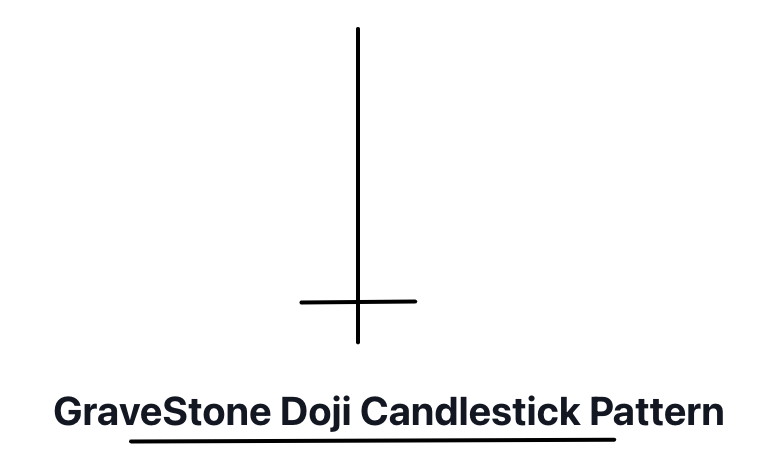
A Gravestone Doji is a bearish reversal candlestick pattern, characterized by a long upper shadow and no lower shadow, with the open, low, and close prices all at the same level.
The Gravestone Doji pattern is named due to its resemblance to a gravestone, representing the bears’ successful attempt to overcome the bulls during a trading session. The pattern is often found at the peak of an uptrend, indicating a potential trend reversal.
How to identify the Gravestone Doji Pattern?
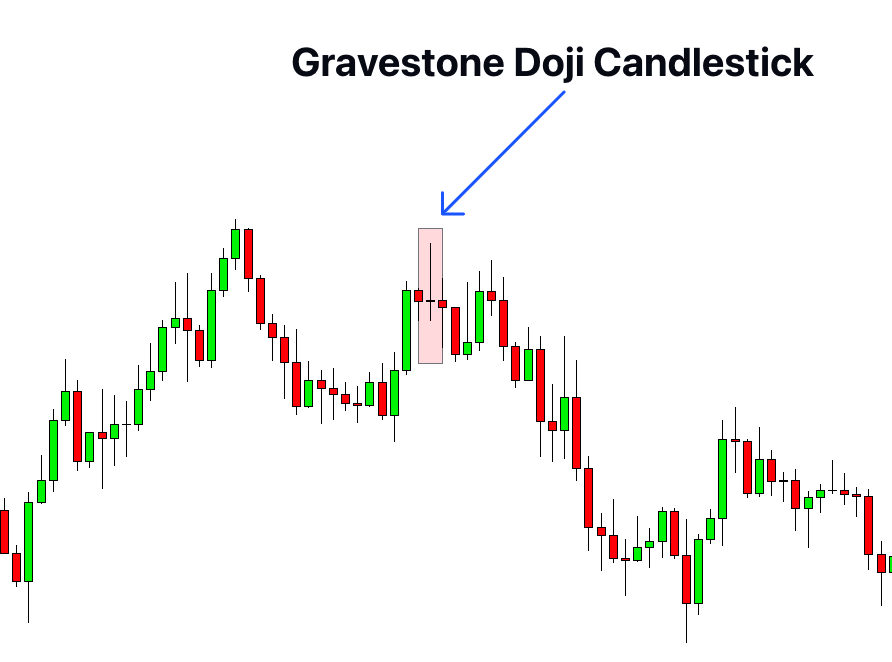
Identifying a Gravestone Doji pattern on the chart involves the following key observations:
1. Formation at the End of an Uptrend: The Gravestone Doji typically forms at the end of an uptrend. This context is critical as it reflects a potential trend reversal from bullish to bearish.
2. Long Upper Shadow: This pattern is characterized by a long upper shadow, which indicates that the bulls drove prices up during the session, but couldn’t sustain those levels by the close.
3. No (or Very Short) Lower Shadow: The Gravestone Doji does not have a lower shadow. If present, it is usually very short. This suggests that the asset’s price did not fall below its opening price during the session.
4. Same Open, Low, and Close Prices: The open, low, and close prices are at the same or nearly the same level. This signals that the bulls couldn’t keep the price high, and the bears were able to bring it back down to the session’s opening level.
In summary, the Gravestone Doji is a single candlestick pattern that is easy to spot on a candlestick chart once you understand what to look for.
Significance
The Gravestone Doji, as a potential bearish reversal signal, carries a high level of significance in technical analysis. Here are the key takeaways:
1. Bearish Reversal Indication: The Gravestone Doji is primarily recognized as a bearish reversal pattern. Its formation, especially at the peak of an uptrend, can indicate that the uptrend may be losing strength and a reversal could be imminent.
2. Power Shift from Bulls to Bears: The pattern illustrates a significant shift in momentum from bulls to bears. During the session, bulls initially pushed prices higher but were overtaken by bears who managed to close the session near the opening level.
3. Confirmation is Crucial: While the Gravestone Doji itself signals a potential reversal, it’s always advised to wait for confirmation. This could come from the next candlestick (a bearish one), or from other technical analysis tools like trendlines, indicators or oscillators.
4. Increased Volatility: The long upper shadow of the Gravestone Doji represents a period of trading where the price was bid up significantly but then fell, indicating increased volatility. Traders should take caution when this happens as it can signify uncertainty in the market.
In essence, the appearance of a Gravestone Doji on your chart is an alert to pay closer attention – the bulls are losing control and the bears might be starting to take over.
Activity of market makers during formation of Gravestone Doji
Understanding the activity of big traders, often known as “smart money” or institutional investors, is crucial in deciphering market dynamics. When a Gravestone Doji pattern forms, it represents a tug-of-war between the bulls and the bears, with the latter gaining the upper hand by the close of the trading session.
- Profit-taking: The appearance of a Gravestone Doji at the end of an uptrend might suggest that big traders are starting to take profits. The session’s price surges, representing an initial continuation of the bullish sentiment. However, as institutional investors begin to sell off their positions, the price falls back down, creating the long upper shadow of the Gravestone Doji.
- Potential Short Positions: Some large traders might interpret the Gravestone Doji as an opportunity to initiate short positions, anticipating a potential trend reversal. This selling pressure can contribute to the fall in price, reinforcing the bearish signal.
- Limited Buying Interest: The Gravestone Doji also suggests that buying interest from large traders is diminishing. Despite the initial upward push, the inability to sustain higher prices indicates that the buying force, whether from big traders or retail investors, is starting to wane.
Retail traders can utilize these insights to gauge potential shifts in market sentiment.
Confluences
To confirm the potential significance of a Gravestone Doji, you may want to consider the following:
| Confirmation Tools | Explanation |
|---|---|
| Key Level | If the Gravestone Doji forms near a known resistance level, it can strengthen the bearish reversal signal. |
| Follow-up candle | A bearish candle following the Gravestone Doji could provide further confirmation of a trend reversal. |
| High Volume | An increased trading volume during the formation of a Gravestone Doji can signify a stronger market conviction. |
| Momentum Indicators | Indicators such as the RSI or MACD showing overbought conditions can enhance the reliability of the reversal signal. |
Key Points
- Best Timeframe: The Gravestone Doji is effective across various timeframes, but its reliability increases with longer periods like the daily or weekly charts. On shorter timeframes (e.g., 1-minute, 5-minute), the pattern may appear more frequently but might be less reliable due to market noise.
- Trading Session: This pattern can be observed in any trading session (e.g., London, New York, Tokyo). However, it may carry more weight during high-liquidity sessions such as the London-New York overlap when significant price moves are more likely to occur.
- Winning Ratio: As with any technical analysis tool, the Gravestone Doji isn’t foolproof. The winning ratio can vary based on several factors, including the market, the instrument traded, and the trader’s skill level. A rough estimate might be in the range of 50-60%, but this percentage can improve when the pattern is used in conjunction with other technical analysis tools and strategies.
Trading Strategy
- Spotting the Pattern: Identify the formation of a Gravestone Doji in an uptrend, preferably at a known resistance level. This establishes the initial setup for a potential bearish reversal.
- Entry Point: The trade entry can be set up on the close of the next candle following the Gravestone Doji. If the subsequent candle closes bearish (lower than the Doji’s open), it may be a good point to enter a short position.
- Stop Loss: Set the stop loss slightly above the highest point of the Gravestone Doji. This is because if the price goes beyond this point, it invalidates the bearish reversal scenario, and it’s safer to limit your loss.
- Take Profit: The take profit level could be set at the next significant support level. The exact level can be identified based on previous price action, trend lines, or Fibonacci retracement levels.
Conclusion
The gravestone doji is a perfect tool to find the bearish trend reversal in the market. i always recommend to use it with resistance zone to get high probability results.

