Definition
The Evening Doji Star is a three-candle bearish reversal pattern that appears at the end of an uptrend, signifying a potential shift from a bullish to a bearish market sentiment.
As a counterpart to the Morning Doji Star, the Evening Doji Star in technical analysis signals that the bulls may be losing control to the bears, providing an opportunity for traders to exit long positions or enter short trades.
How to identify the evening doji star?
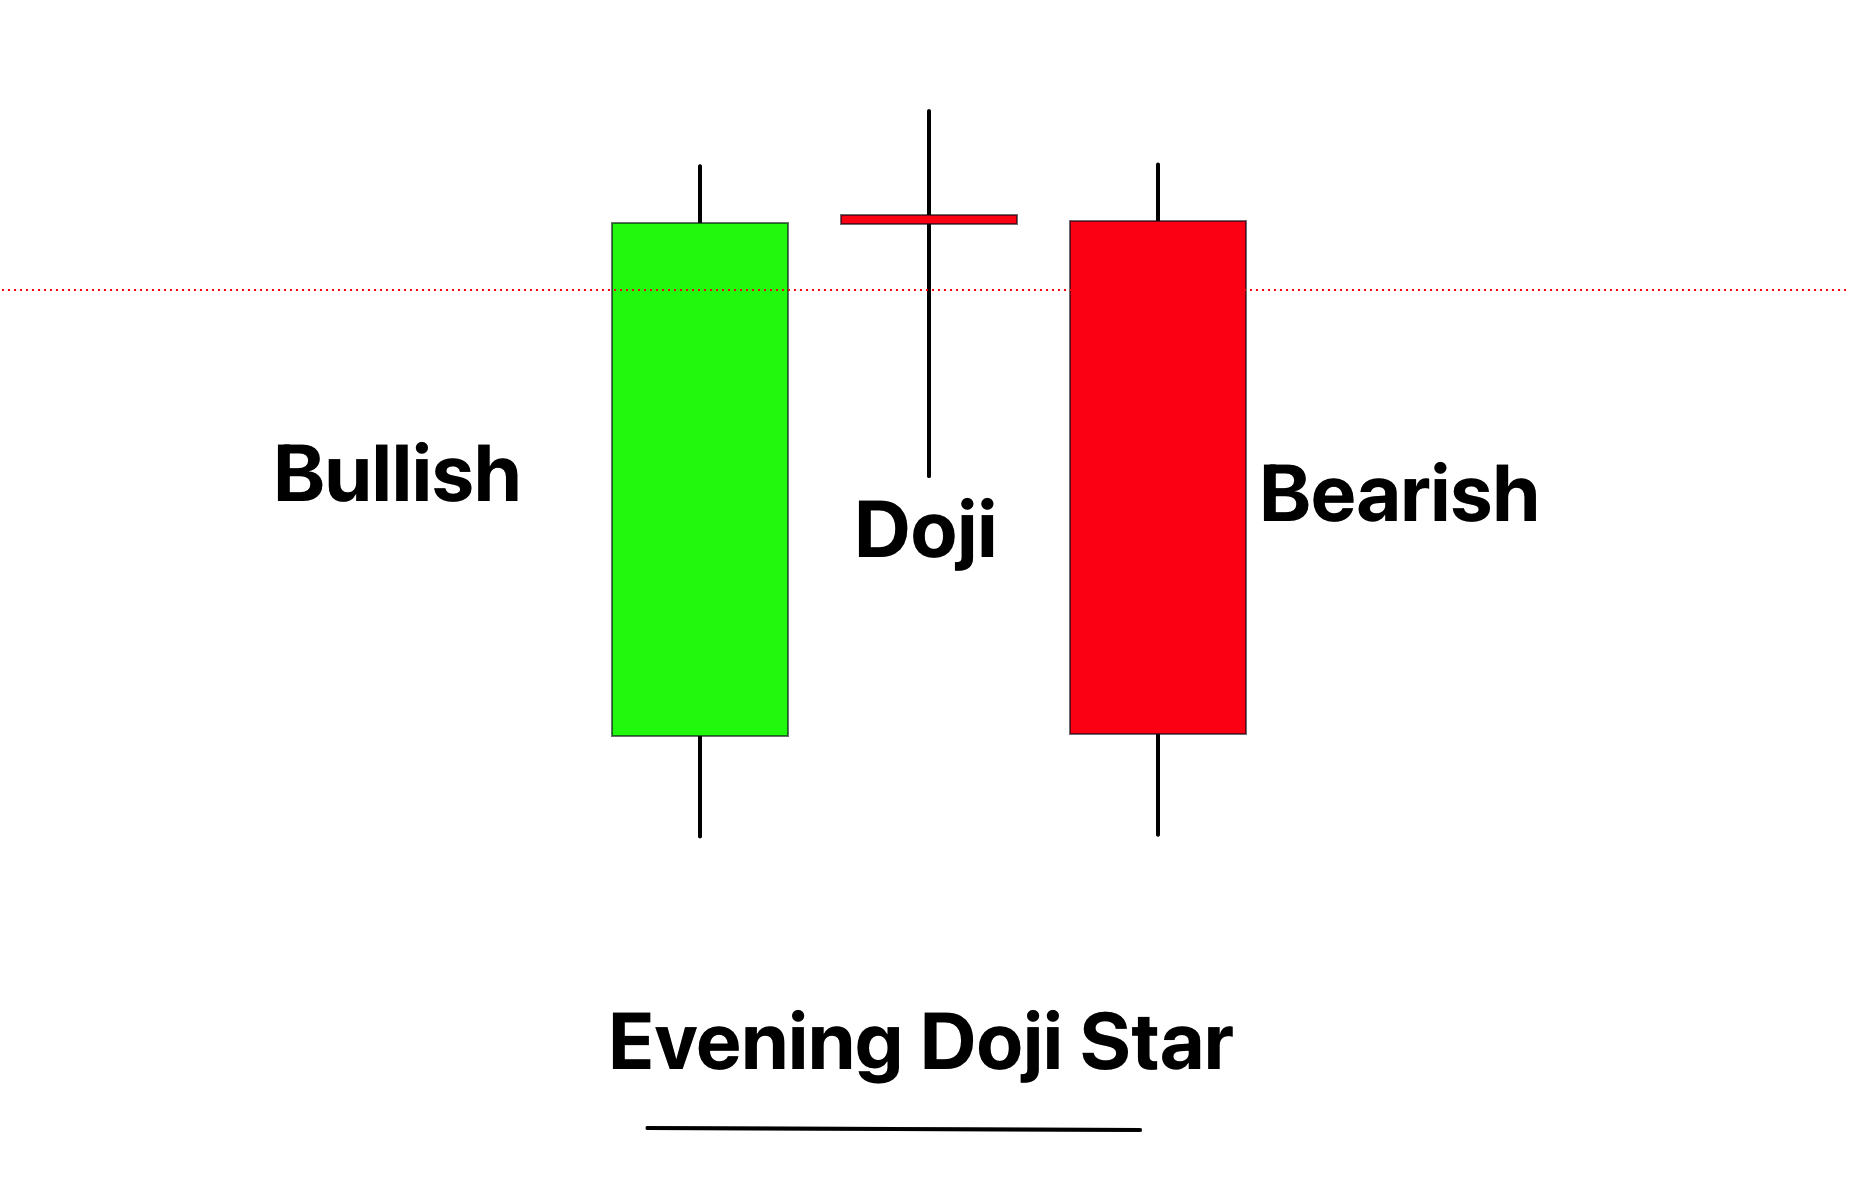
Here are the key points to identify an Evening Doji Star pattern on the chart:
- Uptrend: The pattern should occur after a sustained uptrend. This is crucial as the Evening Doji Star is a bearish reversal pattern, so it needs a prior bullish trend to reverse.
- First Candle: The first candle is a bullish one, continuing the existing uptrend. The body of this candle is typically large, indicating strong buying pressure.
- Second Candle: The second candle is a Doji, where the opening and closing prices are virtually the same. This candle should gap up from the first candle, meaning it opens higher than the first candle’s close, suggesting an initial continuation of the bullish sentiment at the opening, but then a stagnation in price movement.
- Third Candle: The third candle is a bearish one that gaps down from the Doji, meaning it opens below the Doji’s close, and closes within, or below, the body of the first candle. This suggests a potential shift in sentiment from bullish to bearish.
These are the key features you need to look for in an Evening Doji Star.
Significance
The Evening Doji Star is a significant technical analysis pattern as it can indicate a potential bearish reversal, signaling that it may be a good time to exit long positions or consider entering short trades. The pattern forms at the peak of an uptrend and suggests that the bulls, who were previously in control, are potentially losing their grip to the bears.
Let’s break down the significance of each candle in the pattern:
- First Candle (Bullish): This candle represents the continuation of the existing bullish sentiment. Its formation during an uptrend is normal and doesn’t suggest any significant change in the market dynamics.
- Second Candle (Doji): The Doji candle indicates a pause in the trend, reflecting a state of indecision in the market. Both bulls and bears are fighting for control, but neither has gained dominance. This suggests that the bullish momentum may be waning.
- Third Candle (Bearish): This candle opens below the Doji and closes within the body of the first candle, suggesting that the bears have taken control from the bulls. It is an indication that the market sentiment might be turning bearish.
Break down of activity of traders during evening doji star formation
When an Evening Doji Star forms, it reflects a series of changes in the market sentiment that can be tied to the activities of both institutional and retail traders. Here’s a breakdown:
- Bullish Candle: During the formation of the first bullish candle, institutional and big traders continue to buy the asset, pushing prices higher and extending the uptrend. Retail traders, seeing the continuation of the bullish trend, might also be buying during this phase.
- Doji Candle: The Doji signals indecision in the market, suggesting that the buying pressure from the bulls and the selling pressure from the bears are in balance. This can be a result of big traders starting to take profits, slowing the bullish momentum. Alternatively, it could also mean that they are cautiously adding to their short positions, anticipating a possible trend reversal. Retail traders, witnessing this uncertainty, might also begin to exit their long positions or even initiate short trades.
- Bearish Candle: When the third bearish candle forms, it clearly shows that the bears have taken control. This could be due to a combination of factors: big traders adding more to their short positions, further profit-taking from the long side, or new bearish traders entering the market. Meanwhile, seeing the clear bearish signal, retail traders might exit their remaining long positions or open new short ones.
Overall, an Evening Doji Star’s formation indicates a shift from a bullish to a bearish market sentiment, possibly providing a cue for traders to adjust their strategies accordingly.
Confirmations to get high probability trades
Here are a few essential factors in trading with the evening doji star pattern.
| Confirmation Factor | Description |
|---|---|
| Bullish Prior Trend | The Evening Doji Star is a reversal pattern, so its effectiveness is increased when it appears after a clear uptrend. |
| Key Resistance Level | If the pattern forms near a significant resistance level, the likelihood of a bearish reversal could increase. A resistance level is a price point where selling pressure overcomes buying pressure and price rises stall. |
| High Trading Volume | Increased trading volume on the third day (the bearish candle) can validate the pattern, as it indicates strong selling pressure. |
| Overbought RSI | If the Relative Strength Index (RSI) indicates that the asset was overbought (typically an RSI value above 70) during the formation of the Evening Doji Star, it can strengthen the reversal signal. An overbought RSI reading can suggest that the asset’s price might reverse and fall. |
Key Points
Timeframe: The Evening Doji Star is most reliable on longer timeframes, like daily or weekly charts, where it better captures significant changes in market sentiment.
Trading Session: it depends on the market; for instance, in forex, high liquidity periods are preferable, whereas in stocks, it’s the regular trading hours.
Winning Ratio: The pattern’s winning ratio isn’t fixed and depends on various factors, including other technical indicators used for confirmation. However, it could have an accuracy rate of around 65-75% when appropriately confirmed.
Evening doji star trading strategy
Here’s a simple trading strategy using the Evening Doji Star pattern along with the confluence of an overbought RSI:
- Identify an Uptrend: Look for a clear uptrend in the market, as the Evening Doji Star is a bearish reversal pattern.
- Spot the Evening Doji Star: Once you see an Evening Doji Star pattern forming at the end of the uptrend, take note but don’t act just yet.
- Look for Overbought RSI: Check if the Relative Strength Index (RSI) is in the overbought region (typically an RSI value above 70). This suggests that the asset is potentially overpriced and could soon experience a price drop.
- Wait for Confirmation: Wait for the completion of the Evening Doji Star and the next candle to break the low of the pattern. This confirms the bearish reversal.
Now, you can consider entering a trade:
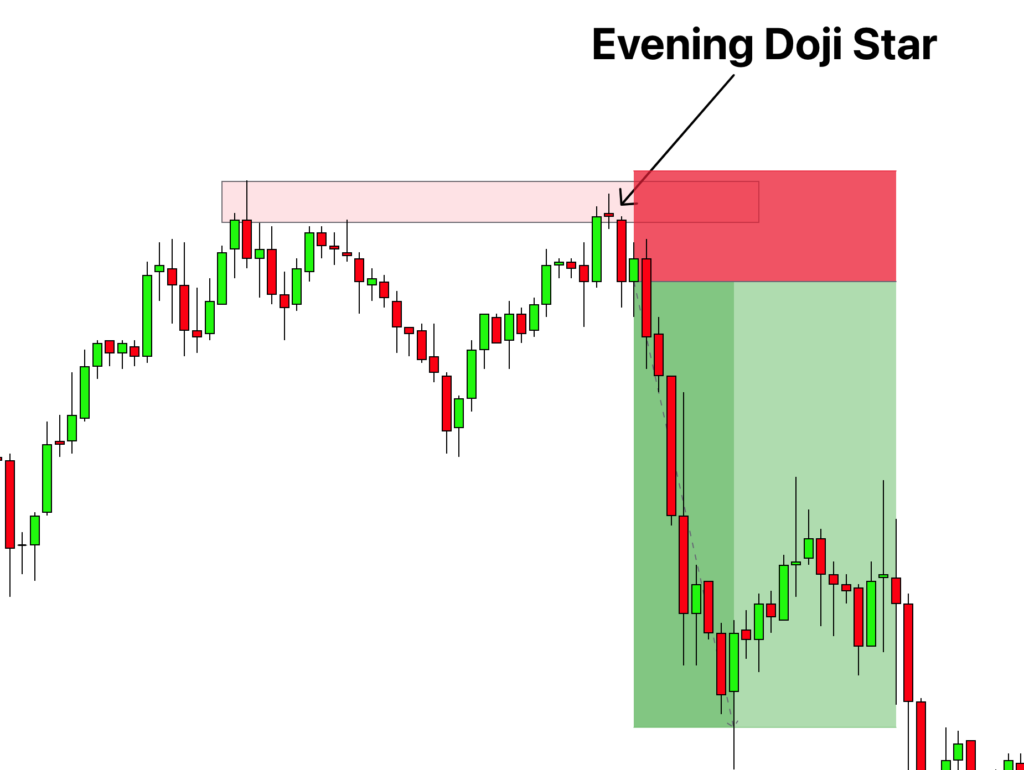
Entry: A potential entry point could be as soon as the price breaks below the low of the Evening Doji Star pattern, confirming the bearish reversal.
Stop Loss: Place a stop loss slightly above the high of the Evening Doji Star. This protects your position if the price unexpectedly rises instead of falling.
Take Profit: Set your take profit level based on your personal risk/reward ratio. A common approach is to aim for a price level equal to the height of the pattern subtracted from the breakout point. Alternatively, you might consider using a trailing stop to capture more profit if the price continues to fall.
Conclusion
The Evening Doji Star is a significant candlestick pattern that helps traders identify potential bearish reversals in the market. It’s particularly useful when it forms after a clear uptrend and near a significant resistance level.
It’s vital for traders, especially beginners, to remember that no pattern guarantees a specific outcome. Confirmation from other technical indicators such as RSI and volume and sound risk management practices can greatly enhance the pattern’s effectiveness.

