Definition:
High Wave Candlestick Pattern is a candle with a small body and long upper and lower shadows, indicating market uncertainty and potential trend reversal. A manifestation of indecision in the market, the High Wave Candlestick Pattern often signals a tug-of-war between buyers and sellers, suggesting a possible change in direction.
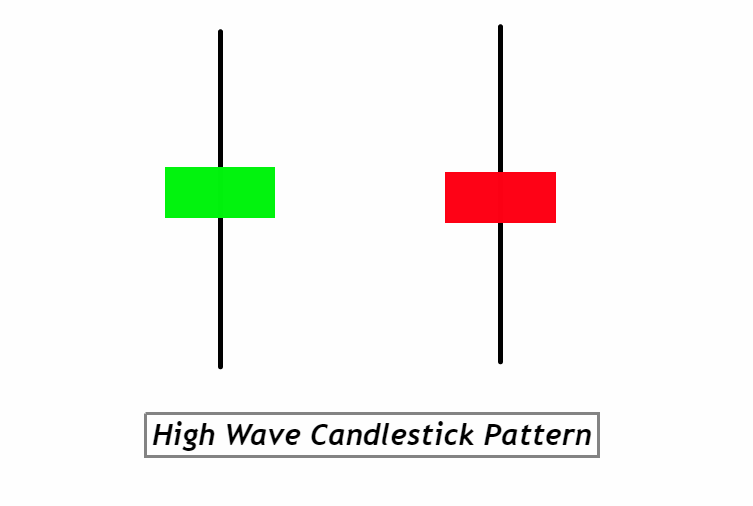
How to Identify the High Wave Candlestick Pattern on a Chart:
- Small Body: The candlestick should have a small real body, which means the difference between the opening and closing price is minimal. This can be a bullish (white or green) or bearish (black or red) body.
- Long Shadows: Look for candlesticks that have both a long upper shadow and a long lower shadow. These shadows indicate a wide trading range between the high and low prices of the session.
- Shadow Length: Ideally, the shadows should be at least twice the length of the real body, showcasing the uncertainty and volatility during that period.
- Positioning: While the pattern can appear anywhere on the chart, its significance is enhanced when it’s observed after a prolonged trend, suggesting potential trend exhaustion and reversal.
- Confirmation: For increased reliability, traders often seek confirmation on the subsequent candle or candles. For instance, after spotting a High Wave at the top of an uptrend, a bearish candlestick on the next day might confirm a potential trend reversal.
By focusing on these characteristics, traders can easily identify the High Wave Candlestick Pattern and use it as an indicator of potential market moves.
Significance and Indications of the High Wave Candlestick Pattern:
- Market Indecision: The primary significance of the High Wave pattern lies in its portrayal of market indecision. The elongated shadows on both sides of a small real body indicate that neither the buyers nor the sellers could gain a decisive advantage during that trading period. For a trader, recognizing such points of indecision can be pivotal, as these often precede more substantial market moves.
- Potential Trend Reversal: The High Wave pattern is especially significant when it appears after a pronounced uptrend or downtrend. In such contexts, it can be an early warning sign of a potential trend reversal. If the market has been rallying and a High Wave emerges, it may indicate that the bulls are losing momentum and a bearish reversal might be around the corner, and vice versa.
- Enhanced with Confirmation: While the High Wave pattern signals potential reversals, professional traders often seek confirmation before making trading decisions. A bearish candlestick following a High Wave at the end of an uptrend or a bullish candlestick after a High Wave at the end of a downtrend can provide this additional layer of confidence in the pattern’s implications.
- Risk Management Tool: For traders, the appearance of a High Wave can be a prompt to tighten stop-loss orders, manage risk, or even consider hedging strategies. Given the uncertainty the pattern represents, it can be a prudent move to prepare for potential heightened volatility or unexpected market swings.
In essence, the High Wave candlestick pattern offers traders a valuable glimpse into moments of market uncertainty, allowing them to make more informed decisions and adjust strategies accordingly.
Activity of Big Traders Behind the High Wave Candlestick Pattern:
- Big Players Testing Waters: When a High Wave pattern emerges, it’s often an indication that large institutional traders or “smart money” are testing the market’s resilience. They might initiate substantial buy or sell orders to gauge the market’s response. The long shadows of the High Wave candlestick reveal these tests – the price is pushed significantly in both directions, but closes near its opening, indicating that the market hasn’t committed to a particular direction yet.
- Profit-Taking and Re-positioning: The High Wave can also signify that big traders are taking profits after a prolonged trend. If the market has been in a sustained uptrend, for instance, the formation of a High Wave might reflect institutional traders liquidating some of their positions, causing the price to momentarily dip. Conversely, in a downtrend, it might indicate buying back of previously shorted positions, leading to a temporary price surge.
- Preparatory Actions for Potential Breakout/Breakdown: The indecision represented by the High Wave can be a prelude to a significant breakout or breakdown. Big traders might be consolidating their positions, preparing to push the market in a decisive direction. For retail traders, this is a cue to be alert and watch subsequent candles for potential breakouts or breakdowns, as a major move might be on the horizon.
- Liquidity and Volume Analysis: It’s crucial to accompany the observation of the High Wave pattern with volume analysis. An unusually high volume during the formation of this pattern could indicate a strong participation of institutional traders. If the volume is low, the pattern might not have the same significance, as it could mean the absence of major players or lack of interest at that price level.
For retail traders, understanding the maneuvers of big players when interpreting the High Wave pattern can offer a deeper insight into the market’s potential direction. By decoding the activities behind the scenes, they can better align their strategies with the market’s larger forces.
Confirmation Tools for the High Wave Candlestick Pattern:
| Tool | Description |
|---|---|
| Key Support/Resistance Levels | If the High Wave pattern forms near established support or resistance levels, it amplifies the probability of a trend reversal. These levels act as psychological barriers in trading, and their validation or breach can confirm the pattern’s implications. |
| Break of Candle’s Low/High | Following the formation of the High Wave, if the subsequent candle breaks the low (in an uptrend) or the high (in a downtrend) of the High Wave, it can be a strong confirmation of trend reversal. This action showcases the market’s commitment to a new direction. |
| Volume Analysis | An increase in volume during or immediately after the High Wave pattern signals active participation by traders. High volume, especially if it’s divergent from the recent average, can be a clear sign of the big players’ involvement, validating the pattern’s significance. |
| Technical Indicators | Indicators such as the RSI (Relative Strength Index), MACD (Moving Average Convergence Divergence), or Stochastic Oscillator can help confirm momentum shifts. For instance, if the RSI shows an overbought or oversold condition in tandem with a High Wave pattern, it further supports the possibility of a reversal. |
Using these confirmation tools in conjunction with the High Wave Candlestick Pattern can significantly enhance trading accuracy, providing traders with a more comprehensive view of the market’s potential direction.
Optimizing the High Wave Candlestick Pattern:
Best Timeframe: For trading the High Wave pattern, the daily timeframe (1D) tends to be the most reliable. While it can appear on shorter timeframes like the 1-hour or 4-hour, the daily chart offers a more holistic view of market sentiment, reducing the noise of intraday fluctuations.
Trading Session: The pattern’s effectiveness is highest during major trading sessions when liquidity is ample. This usually means the London and New York sessions for Forex traders. For stock traders, the first two hours after the market opens and the last hour before the close are typically the most active and decisive.
Winning Ratio: While results vary based on the market, asset, and broader conditions, with proper confirmation tools, traders can expect a winning ratio of approximately 60-70% when trading the High Wave pattern. However, always ensure risk management practices are in place, as no pattern offers guaranteed outcomes.
Remember, while these guidelines provide a starting point, every trader should backtest and adjust based on their experience and market conditions.
High Wave Candlestick Pattern: Confluence Trading Strategy
- Confluence Factors:
- Look for other technical signals that align with the High Wave pattern’s message. These might include:
- Divergence with momentum indicators (like RSI or MACD).
- Fibonacci retracement levels aligning with the High Wave’s formation.
- Price action touching a significant moving average (like the 50 or 200-day MA).
- Look for other technical signals that align with the High Wave pattern’s message. These might include:
- Entry:
- For a potential downtrend reversal (High Wave formed after a decline): Enter a buy position when the subsequent candle closes above the High Wave’s high.
- For a potential uptrend reversal (High Wave formed after a rally): Enter a sell position when the subsequent candle closes below the High Wave’s low.
- Stop-Loss:
- For a buy entry: Place the stop-loss just below the low of the High Wave candle.
- For a sell entry: Place the stop-loss just above the high of the High Wave candle.
- Take Profit Level:
- Target a risk-reward ratio of at least 1:2 or 1:3. For example, if your stop loss is 20 pips from your entry point, aim for a take profit level 40 to 60 pips away.
- Alternatively, use key support (for sell trades) or resistance (for buy trades) levels as your take profit targets.
Conclusion:
The High Wave candlestick pattern is a potent signal of market indecision, often hinting at potential trend reversals. By adding confluence factors, traders can increase the reliability of this pattern, making it a strategic tool in their arsenal. As with all trading strategies, it’s essential to practice good risk management and adjust the strategy based on evolving market conditions and personal experience.

