Definition
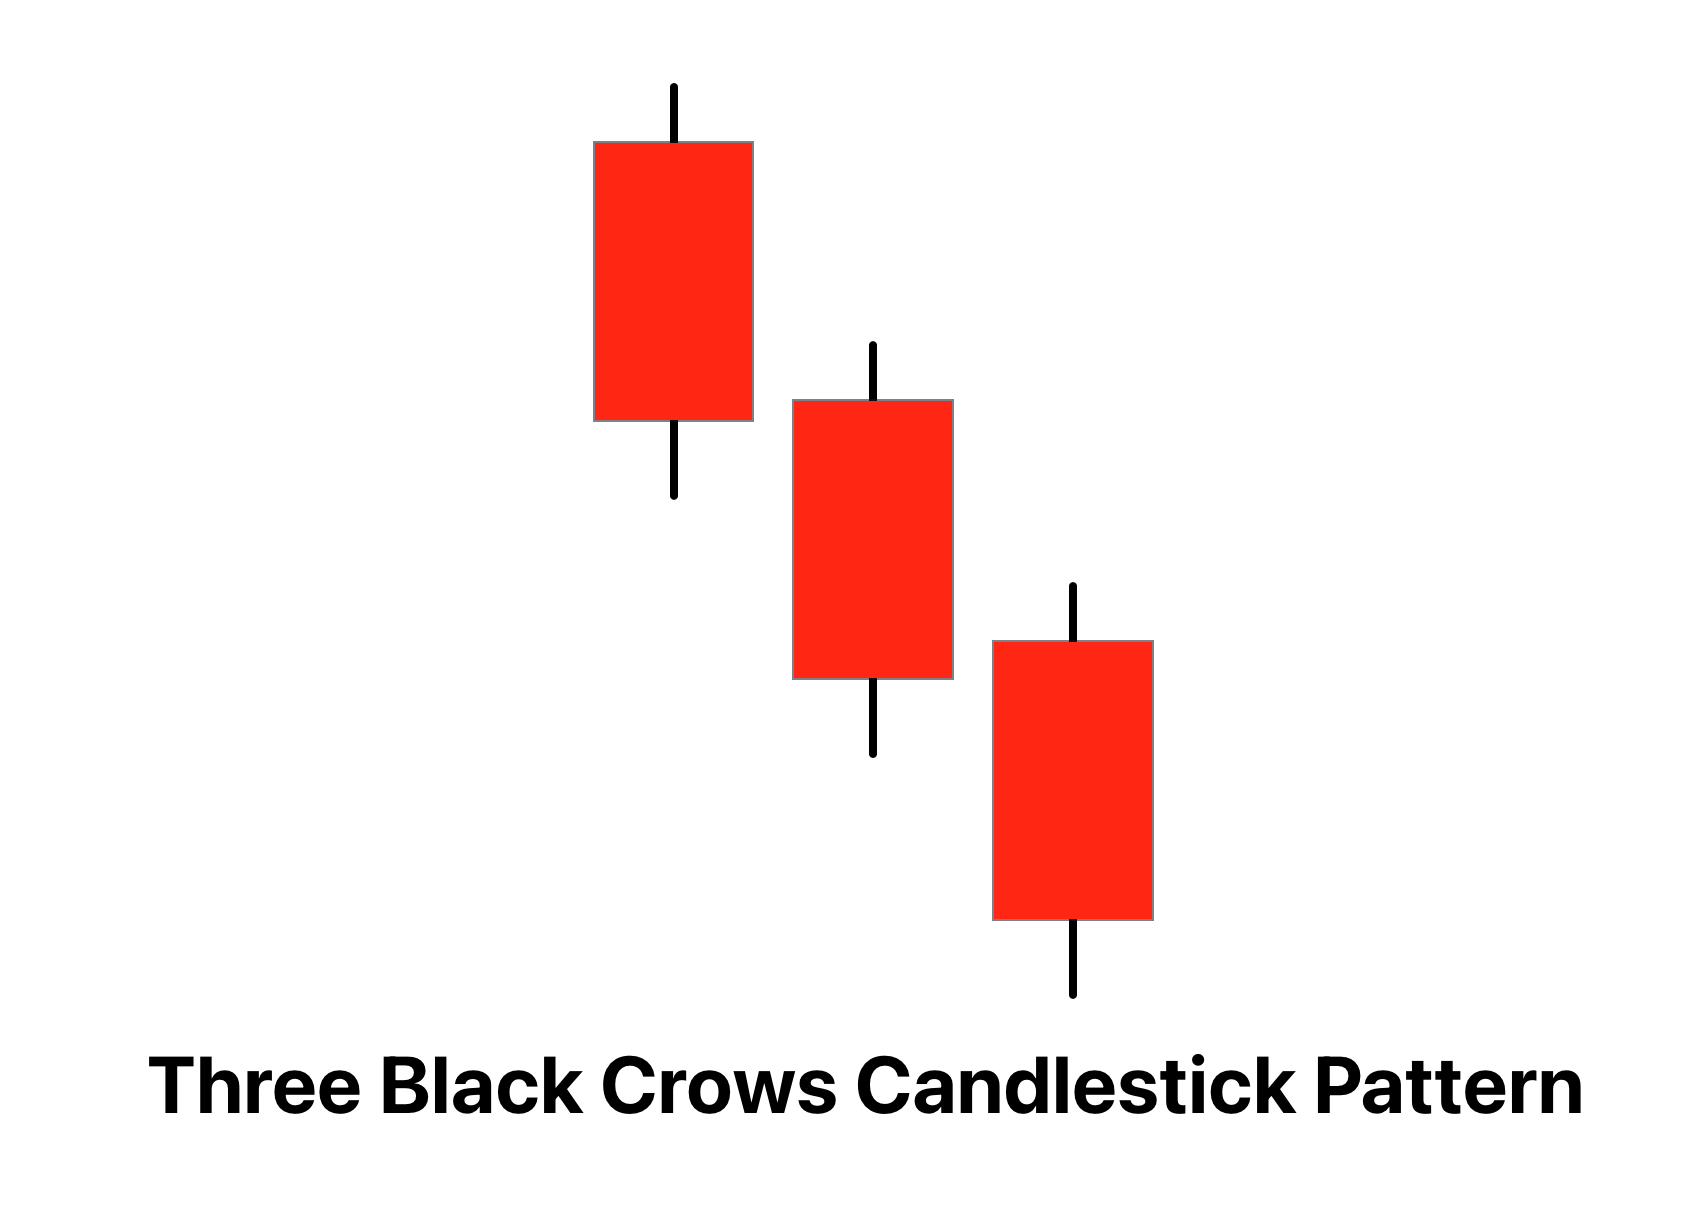
A Three Black Crows pattern is a bearish reversal pattern consisting of three consecutive long-bodied, bearish candles, each opening within the body of the previous candle and closing at or near its low, signaling a shift from bullish to bearish momentum. it provides traders with a clear visual cue of changing market sentiment and a potential downturn in price.
How to find the Three Black Crows Candlestick Pattern?
To identify the Three Black Crows pattern on a chart, you’ll want to look out for the following key characteristics:
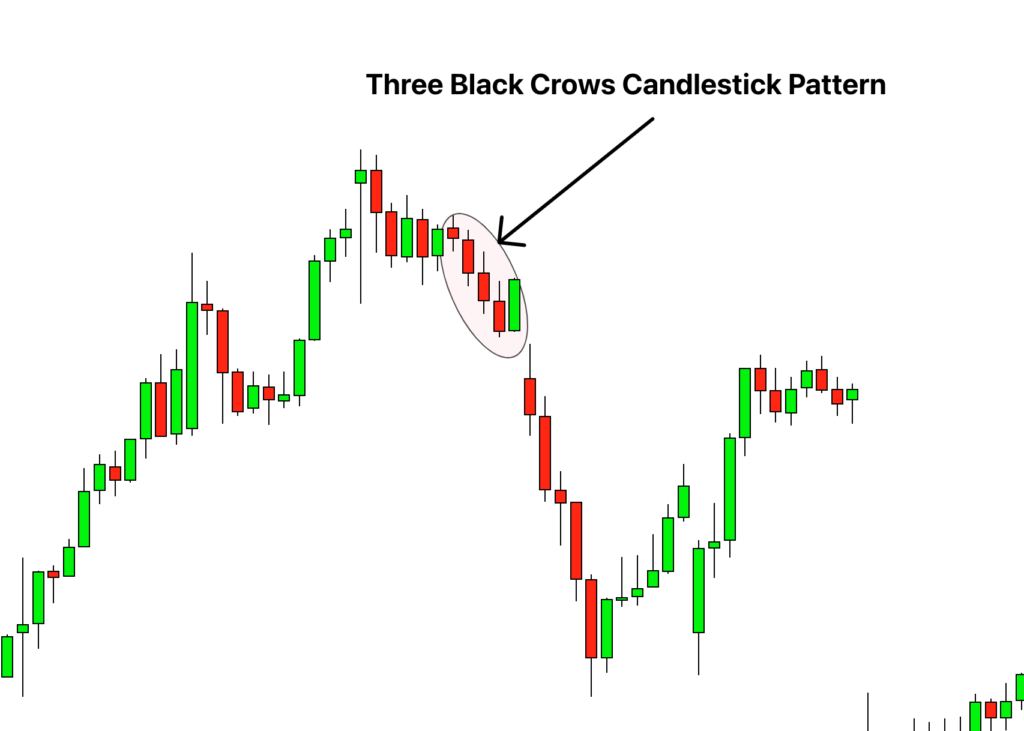
- Preceding Uptrend: First, the pattern typically appears after a sustained uptrend or at a price peak. This is because Three Black Crows represent a reversal pattern, signaling a change from bullish to bearish market sentiment.
- Three Consecutive Bearish Candles: Look for a series of three consecutive bearish (or ‘black’) candles. Each of these candles should open within the body of the previous candle.
- Candle Characteristics: Each of the three candles should have a long real body, indicating a strong price decline from open to close. Additionally, the candles should close near their lows, indicating that sellers controlled the price action throughout the entire trading period.
- Progressive Lower Lows: Each candle should close at a new low for the three-day sequence, implying a steady downward movement.
Significance
The Three Black Crows pattern holds significant importance in technical analysis, mainly for its bearish implications and its role in identifying potential reversals. Here’s what it typically signifies:
- Bearish Reversal: The appearance of the Three Black Crows after a strong uptrend signifies a potential bearish reversal, meaning that the asset’s price may be about to embark on a downward trajectory.
- Strong Selling Pressure: The formation of three consecutive long-bodied bearish candles reflects strong selling pressure in the market, suggesting that sellers have taken control from buyers.
- Confirmation of Downtrend: If followed by additional bearish candles or confirmed by other technical indicators, the Three Black Crows can confirm the start of a downtrend.
- Trading Opportunities: For traders, this pattern can provide an opportunity to either exit long positions or initiate new short positions in anticipation of further price decline.
Activity of traders during formation of three black crows pattern
When the Three Black Crows pattern forms on the chart, it can provide insights into the activities of big traders, or institutional investors, which can guide retail traders in making more informed decisions.
- Selling Activity: The emergence of the Three Black Crows pattern suggests that large traders may be offloading their positions. The sustained selling pressure over three periods that forms this pattern often indicates substantial selling activity by institutional investors.
- Profit Taking: The pattern often appears at the end of an uptrend, indicating that big players may be taking profits on their long positions, which can lead to a reversal in price direction.
- Short Positions: The Three Black Crows pattern can also signal that big traders are opening short positions, anticipating a downturn. This increase in short selling can exacerbate the selling pressure, leading to a more pronounced price decline.
- Signaling Market Tops: Big traders often use this pattern as a signal of potential market tops, especially when it appears at a key resistance level or after a prolonged uptrend.
For retail traders, understanding the potential behavior of big traders around the formation of the Three Black Crows pattern can help them align their trading strategy with larger market forces.
Confirmation tools that a trader should use
To increase the reliability of the Three Black Crows pattern, several confirmation tools can be used:
| Confirmation Tool | Description |
|---|---|
| Key Resistance Level | If the Three Black Crows pattern forms at a significant resistance level, it can increase the likelihood of a bearish reversal. |
| Break of Low After Pattern Formation | A break below the low of the last crow in the pattern after it forms can further confirm the bearish reversal. |
| High Volume | If the Three Black Crows pattern is accompanied by high trading volume, it suggests strong selling pressure, reinforcing the validity of the reversal. |
Key points to remember
- Best Timeframe: The Three Black Crows pattern can technically form on any timeframe. However, its reliability tends to increase on higher timeframes such as the daily or weekly charts, due to less market noise and more substantial data.
- Trading Session: This pattern can occur in any trading session, including the US, European, or Asian markets. However, its effectiveness is typically higher in sessions with greater liquidity and volume.
- Winning Ratio: The success rate of the Three Black Crows pattern can vary based on market conditions and the trader’s skill level. With the proper use of confirmation tools and careful risk management, a winning ratio between 50-60% could be targeted, though individual results may vary.
Trading Strategy
Three Black Crows trading strategy can provide traders with clear entry, exit, and risk management signals. Here’s a simple trading strategy that utilizes the Three Black Crows pattern:
- Identify the Pattern: First, identify the Three Black Crows pattern on the chart. Remember, it should occur after an uptrend and consist of three consecutive long-bodied, bearish candles.
- Confirm with Other Tools: Seek confluence with other technical indicators or tools to confirm the bearish signal. This could include checking for resistance levels, monitoring trading volume, and using technical indicators like RSI or MACD.
- Entry Point: Consider entering a short position at the opening of the candle following the completion of the Three Black Crows pattern, especially if other confirmation tools align.
- Stop-Loss: Place a stop-loss above the high of the third crow in the pattern to manage your risk. Ensure your stop-loss level considers the asset’s volatility and your risk tolerance.
- Take-Profit: Set a take-profit level based on a risk-reward ratio that suits your trading strategy. A commonly used approach is to aim for a risk-reward ratio of at least 1:2.
Conclusion
In conclusion, the Three Black Crows is a bearish reversal pattern that provides traders with an opportunity to take advantage of potential price downturns. This pattern, signifying a shift from bullish to bearish sentiment, is potent when used alongside other technical tools like key resistance levels, high trading volume, or technical indicators.
When used within a disciplined trading strategy that includes careful risk management, the Three Black Crows can be a highly effective tool for predicting price reversals and guiding trading decisions.
As always, successful trading involves not just pattern recognition but also understanding market dynamics, managing risk, and maintaining discipline.

