Definition
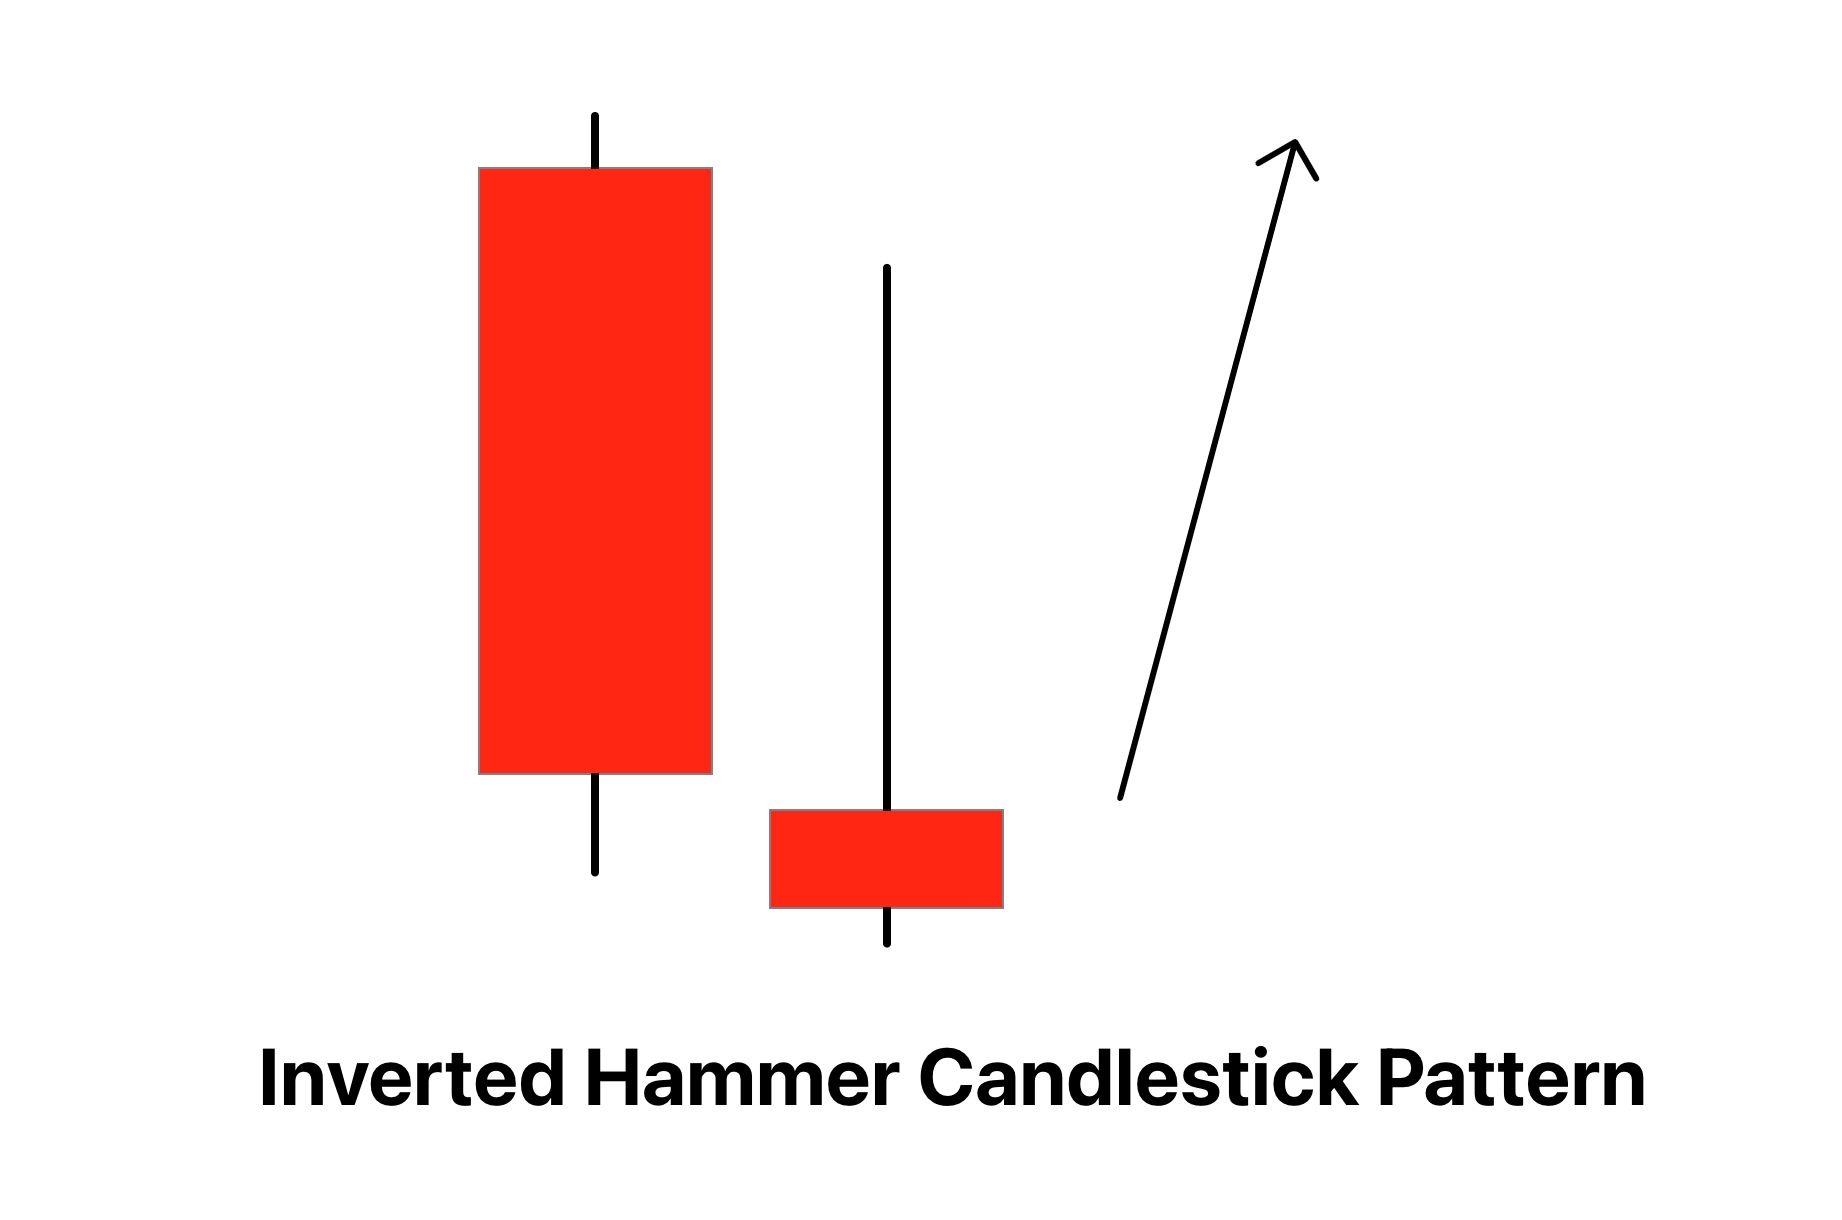
The Inverted Hammer is a bullish reversal candlestick pattern characterized by a small body at the lower end of the trading range with a long upper shadow and little or no lower shadow.
The Inverted Hammer pattern signals the potential for a bullish reversal following a downtrend, typically suggesting the diminishing of selling pressure and the possibility of a price rally.
How to identify the inverted hammer candlestick?
To spot an Inverted Hammer candlestick pattern on the chart, follow these key points:
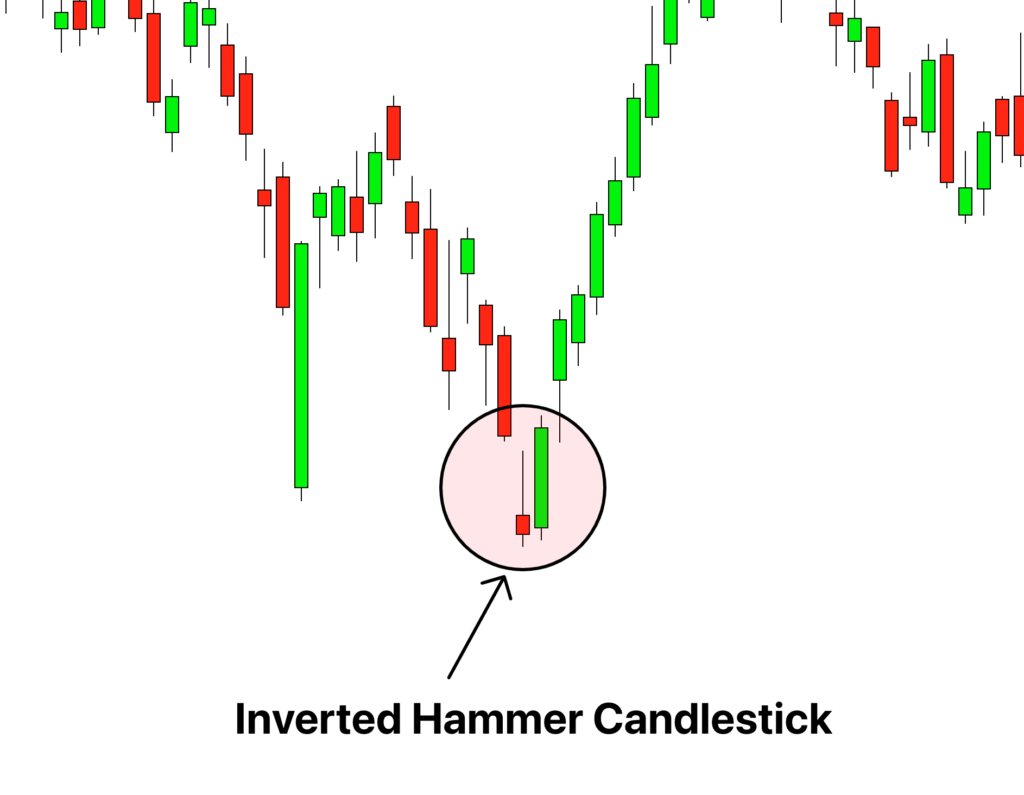
- Existing Downtrend: The Inverted Hammer pattern is a bullish reversal pattern, and thus should appear after a notable downtrend in price. This context is important, as the same pattern in an uptrend may not have the same bullish implications.
- Candle Shape: The Inverted Hammer candlestick has a small body at the lower end of the trading range, a long upper shadow (wick) that is typically at least twice the length of the body, and either no lower shadow (wick) or a very short one.
- Color of the Candle Body: The body of the Inverted Hammer can be either bearish (red or black, if the close is lower than the open) or bullish (green or white, if the close is higher than the open). Both variations are generally considered Inverted Hammer patterns.
- Next Candle Confirmation: The bullish reversal implication of the Inverted Hammer is confirmed by the next candle. If the next candle closes above the high of the Inverted Hammer, it provides confirmation of the reversal.
Significance
The Inverted Hammer candlestick pattern holds a significant place in technical analysis due to its potential to indicate reversals in price trends. It typically forms at the bottom of a downtrend, suggesting the possibility of a bullish reversal, and therefore has bullish implications. Here are a few points explaining its significance and indications:
- Diminishing Selling Pressure: The long upper shadow of the Inverted Hammer represents a period during the trading session where buyers pushed prices significantly higher, although the sellers managed to pull the prices down to close near the open. This struggle between buyers and sellers indicates a decrease in selling pressure.
- Potential Price Reversal: If the candle following the Inverted Hammer closes above the high of the Inverted Hammer, it confirms a bullish reversal. This suggests that the buying pressure has overcome selling pressure, and the price may start to rise.
- Market Sentiment Shift: The formation of an Inverted Hammer may indicate a shift in market sentiment. Where sellers previously dominated during the downtrend, buyers are beginning to step in, signaling a potential reversal to the upside.
- Trading Opportunities: For traders, the appearance of an Inverted Hammer can provide an opportunity to enter long positions or exit short positions, as it indicates that the bulls are gaining ground.
Activity of traders during formation of inverted hammer pattern
When an Inverted Hammer pattern forms, it provides a glimpse into the activity of large or institutional traders, often referred to as ‘smart money’. Understanding their behavior can offer retail traders valuable insights for crafting their trading strategies. Here’s how their activity might be interpreted:
- Testing the Waters: The formation of an Inverted Hammer, especially with a long upper shadow, can indicate that large traders are probing for a potential bottom in the price. The long upper shadow shows an attempt to push the price up, hinting that big players might be assessing the strength of remaining sellers.
- Absorbing Selling Pressure: Big traders often use downtrends to accumulate their positions. The Inverted Hammer pattern could be an indication of such accumulation, where large traders absorb the selling pressure, preventing the price from closing significantly lower.
- Shifting Momentum: The presence of an Inverted Hammer after a sustained downtrend can suggest that large traders are preparing for a potential reversal. If followed by a bullish candle, it may imply that the big traders have started building long positions, which can drive the price up.
- Creating a Trap: Sometimes, smart money might create false signals to trap less experienced traders. While an Inverted Hammer is generally a bullish signal, it requires confirmation from the following candle(s) to validate the reversal.
Confirmation tool
Here are four confirmation tools that can increase the reliability of an Inverted Hammer candlestick pattern:
| Confirmation Tool | Application with Inverted Hammer |
|---|---|
| 1. Key Level (Support or Fibonacci Level) | The Inverted Hammer tends to hold more weight when it forms at a significant support level or key Fibonacci retracement level (e.g., 0.618). This adds a layer of confluence to the potential bullish reversal. |
| 2. Break of High After Pattern Formation | For the bullish reversal to be confirmed, the price should break above the high of the Inverted Hammer in the following trading session(s). This suggests that buyers are taking control. |
| 3. Volume | An increase in trading volume on the day the Inverted Hammer forms and/or the next day provides extra confirmation of the pattern. High volume indicates strong participation, suggesting the reversal may have more momentum. |
Best settings for inverted hammer candlestick
Best Timeframe: The Inverted Hammer, like many candlestick patterns, can be identified across various timeframes. However, it generally holds more significance on longer timeframes, such as daily or weekly charts, as they incorporate more data and better represent market sentiment.
Trading Session: The pattern is universally applicable and can be spotted in any trading session, be it the London, New York, or Asian sessions. The key is that the session must have enough liquidity and volatility for the pattern to form and for a possible reversal to occur.
Winning Ratio: The winning ratio of the Inverted Hammer pattern can vary widely depending on the overall market context and the trader’s skill in executing and managing trades. As a standalone pattern, without any other forms of analysis or confirmation, it might provide a winning ratio around 50-60%.
Trading strategy
This trading strategy involves the Inverted Hammer candlestick pattern and the confluence of key levels:
1. Identify an Inverted Hammer: The first step is to spot an Inverted Hammer candlestick pattern at the end of a downtrend.
2. Identify a Key Level: Look for a key support level where the Inverted Hammer forms. This could be a historical price level where the asset’s price has previously bounced back, or it could be a key Fibonacci retracement level.
3. Wait for Confirmation: Once you’ve identified the pattern and key level, don’t rush to enter the trade. Wait for the next candle to confirm the bullish reversal. Ideally, it should close above the high of the Inverted Hammer.
4. Entry Point: Your entry point should ideally be at the closing of the confirmation candle or, in more aggressive strategies, at the break of the high of the Inverted Hammer.
5. Stop Loss: The stop loss should be placed below the low of the Inverted Hammer. This represents the point at which the potential bullish reversal is invalidated.
6. Take Profit: As for the take profit level, it can be identified based on resistance levels or a risk-reward ratio. For instance, if your stop loss is 20 pips below your entry point, you might set your take profit level at 40 pips above your entry point, giving a risk/reward ratio of 1:2.
Conclusion
To conclude, the Inverted Hammer candlestick pattern is a potentially powerful tool in a trader’s arsenal. Its formation indicates a potential bullish reversal in a downtrend, signaling a potential buying opportunity. However, as with any technical analysis tool, it is most effective when used in conjunction with other indicators.
Confirmation tools such as key levels, high volume, and pattern breaks enhance the pattern’s reliability and increase the probability of successful trades. It’s also important to note that this pattern works best on higher timeframes and in volatile trading sessions where it can truly form.

