Definition:
A Stalled Candlestick Pattern consists of three candles: two strong bullish candles followed by a smaller bullish or doji candle, indicating a potential bearish reversal in an uptrend. Often appearing at the peak of an uptrend, the Stalled Candlestick Pattern signals hesitation in the market, suggesting that bulls may be losing control.
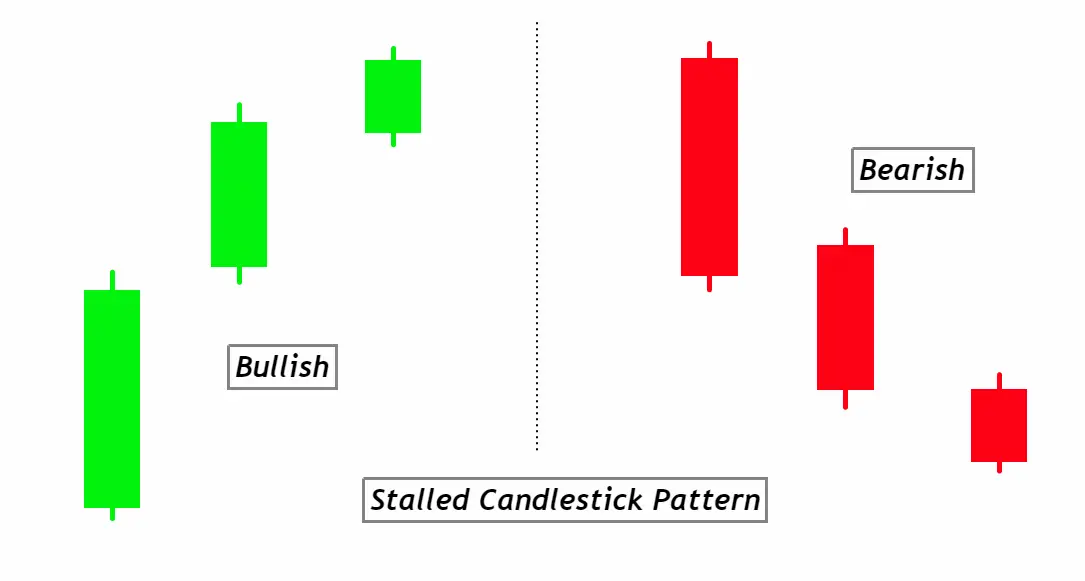
How to Identify the Stalled Candlestick Pattern on a Chart:
- Uptrend Confirmation: Look for a prevailing uptrend in the market. This pattern is significant when it appears after a noticeable bullish move.
- First Candle: Identify a strong bullish (green or white) candle as the first candle in the potential pattern. This candle should have a relatively large body, indicating a clear move upward.
- Second Candle: The second candle should also be bullish, with its close higher than the first candle. Its body should be roughly the same size or even larger than the first candle’s body, signaling continued bullish momentum.
- Third Candle: The third candle is critical. It should be smaller than the previous two candles, and it can be a bullish candle, a doji (where the open and close prices are virtually the same), or even a slightly bearish candle. Its high should not exceed the high of the second candle.
- Wicks/Shadows: While the body of the candles is vital, the wicks or shadows can also provide clues. If the third candle has a long upper wick or shadow, it can strengthen the indication of an impending bearish reversal.
- Volume Analysis (Optional): Some traders incorporate volume analysis. If the volume diminishes on the third candle compared to the first two, it can be a sign of decreasing bullish interest.
Significance and Indications of the Stalled Candlestick Pattern:
Market Hesitation: At its core, the Stalled Candlestick Pattern is an embodiment of market hesitation. The pattern’s emergence after a strong bullish trend serves as a warning signal for traders. The first two bullish candles demonstrate strength, but the smaller third candle indicates that the upward momentum may be waning. This fading enthusiasm often suggests that the bulls are starting to lose their grip, making this pattern a potential precursor to a bearish reversal or a consolidation phase.
Risk Management: For traders, especially those who rode the bullish wave, recognizing this pattern can be crucial for risk management. It provides an opportunity to lock in profits, adjust stop losses, or even consider short positions. Essentially, it offers traders a proactive approach to safeguarding their positions before a potential trend reversal.
Confirmation with Other Indicators: The Stalled Candlestick Pattern gains added significance when aligned with other technical indicators or resistance levels. For instance, if this pattern appears near a known resistance level, or if oscillators like the RSI show the market is overbought, the bearish reversal indication strengthens. Combining insights from various tools enhances the pattern’s reliability in forecasting the market’s next move.
Beneficial for All Trading Horizons: Whether you’re a day trader or a swing trader, this pattern offers value. For day traders, it can indicate a short-term change in momentum, while for swing traders, it can signal a more extended period of bearishness or consolidation. Recognizing the pattern allows traders of all horizons to adjust their strategies accordingly, giving them a competitive edge in the market.
Activity of Big Traders During the Formation of the Stalled Candlestick Pattern:
Positional Adjustments: When the Stalled Pattern forms, especially after a substantial uptrend, it often indicates that institutional or “big” traders are adjusting their positions. This adjustment can be in the form of taking profits, reducing their exposure to a stock or market, or even hedging their positions. Their activity directly impacts the market due to the sheer volume of their trades, and this can manifest as the waning momentum we see in the third candle.
Liquidity Seeking: Big traders require substantial liquidity to enter or exit positions without causing massive price swings. The strong bullish run preceding the Stalled Pattern might have been driven by aggressive buying from these traders. When they sense a potential top or waning momentum, they might look to offload positions. The third candle’s diminished size can be an outcome of reduced buying interest, as institutional traders might not find enough liquidity at higher levels to offload significant quantities without moving the price drastically.
Order Clustering: Behind the scenes, stop-loss orders, take-profit orders, and other conditional orders often cluster around technical levels. If the Stalled Pattern forms near such a key resistance level, it’s possible that big traders are acutely aware of these order clusters. By reducing their buying interest or actively selling, they can trigger these stops, leading to an accelerated move downwards. This cascading effect can work to their advantage if they’re looking to buy at lower levels or benefit from short positions.
Sentiment Play: Institutional traders are also well-versed in market sentiment. By recognizing patterns like the Stalled Candlestick, they understand how retail traders might react. If they anticipate a bearish turn or even a self-fulfilling prophecy due to the pattern’s recognition, they might strategically pull back, letting the market’s sentiment shift. Retail traders, seeing the potential top, might then act in a way that confirms the initial hesitation, solidifying the pattern’s implications.
For retail traders, understanding the potential behind-the-scenes maneuvers of larger players offers a more profound insight into market dynamics. Recognizing that the formation of such patterns isn’t merely technical, but also a reflection of strategic actions by influential market participants, can enrich decision-making processes and forecasting accuracy.
High Probability Confirmation Tools for the Stalled Candlestick Pattern:
| Tool/Indicator | Confirmation Criteria |
|---|---|
| Key Levels (Support/Resistance) | The pattern forms near a significant resistance (for bullish trend reversal) or support level, indicating that the market is testing these levels and may potentially reverse. |
| Break of Low After Pattern | A breach of the low of the third candle or even the second one post-pattern is a strong indication of the bearish reversal and confirms the pattern’s validity. |
| Volume Analysis | A decreasing volume on the third candle, compared to the first two, indicates diminishing bullish interest. A spike in bearish volume after the pattern can confirm a reversal. |
| Technical Oscillators | Oscillators like RSI or MACD showing overbought conditions or bearish divergence can strengthen the indication of an impending reversal and validate the Stalled Pattern. |
Utilizing these confirmation tools alongside the Stalled Candlestick Pattern can offer traders a more comprehensive view of the market’s potential direction, enhancing their decision-making process.
Optimal Conditions for Trading the Stalled Candlestick Pattern:
Best Timeframe: For the clearest indications and to filter out ‘noise’, the Daily timeframe (1D) is often preferred. It provides a comprehensive view of market sentiment over a day, balancing both precision and broader trend context.
Trading Session: The pattern’s strength is most notable when observed during the main trading sessions of the asset in question, such as the New York session for USD pairs or London session for major European assets. This is when the most liquidity and institutional activity are typically present.
Winning Ratio: With optimal confirmations, the Stalled Candlestick Pattern can offer a winning ratio of around 60-70%. However, this is a ballpark figure and can vary based on the asset, market conditions, and accompanying analysis tools. Always back-test on your chosen instrument before full deployment.
Trading Strategy with Confluence for the Stalled Candlestick Pattern:
1. Entry Point: Confluence is about layering multiple technical factors to enhance the probability of a trade. When the Stalled Candlestick Pattern forms, wait for another confirmatory signal. This could be a bearish candlestick pattern post the stalled formation, a bearish divergence on an oscillator, or a clear rejection from a known resistance level. Once these align, consider entering a short trade after the close of the confirmation candle.
2. Stop Loss: Place the stop loss slightly above the high of the third candle or the confirmatory signal, ensuring a buffer for normal market volatility. If the market moves above this point, it might negate the bearish premise of the Stalled Pattern.
3. Take Profit Level: A common approach is to aim for a risk-reward ratio of at least 1:2. For instance, if your stop loss is 20 pips from your entry point, set your take profit at 40 pips. Additionally, look for previous support levels; they can act as potential profit-taking areas since the price might stall or bounce at these levels.
Conclusion:
The Stalled Candlestick Pattern is a powerful indicator of potential market reversals when used in the right context. By employing a strategy with confluence, traders enhance the odds in their favor, ensuring more systematic and probabilistic decision-making. As always, it’s crucial to remember that no pattern or strategy guarantees 100% success. It’s the consistent application, risk management, and continuous learning that lead to trading proficiency.

