Definition
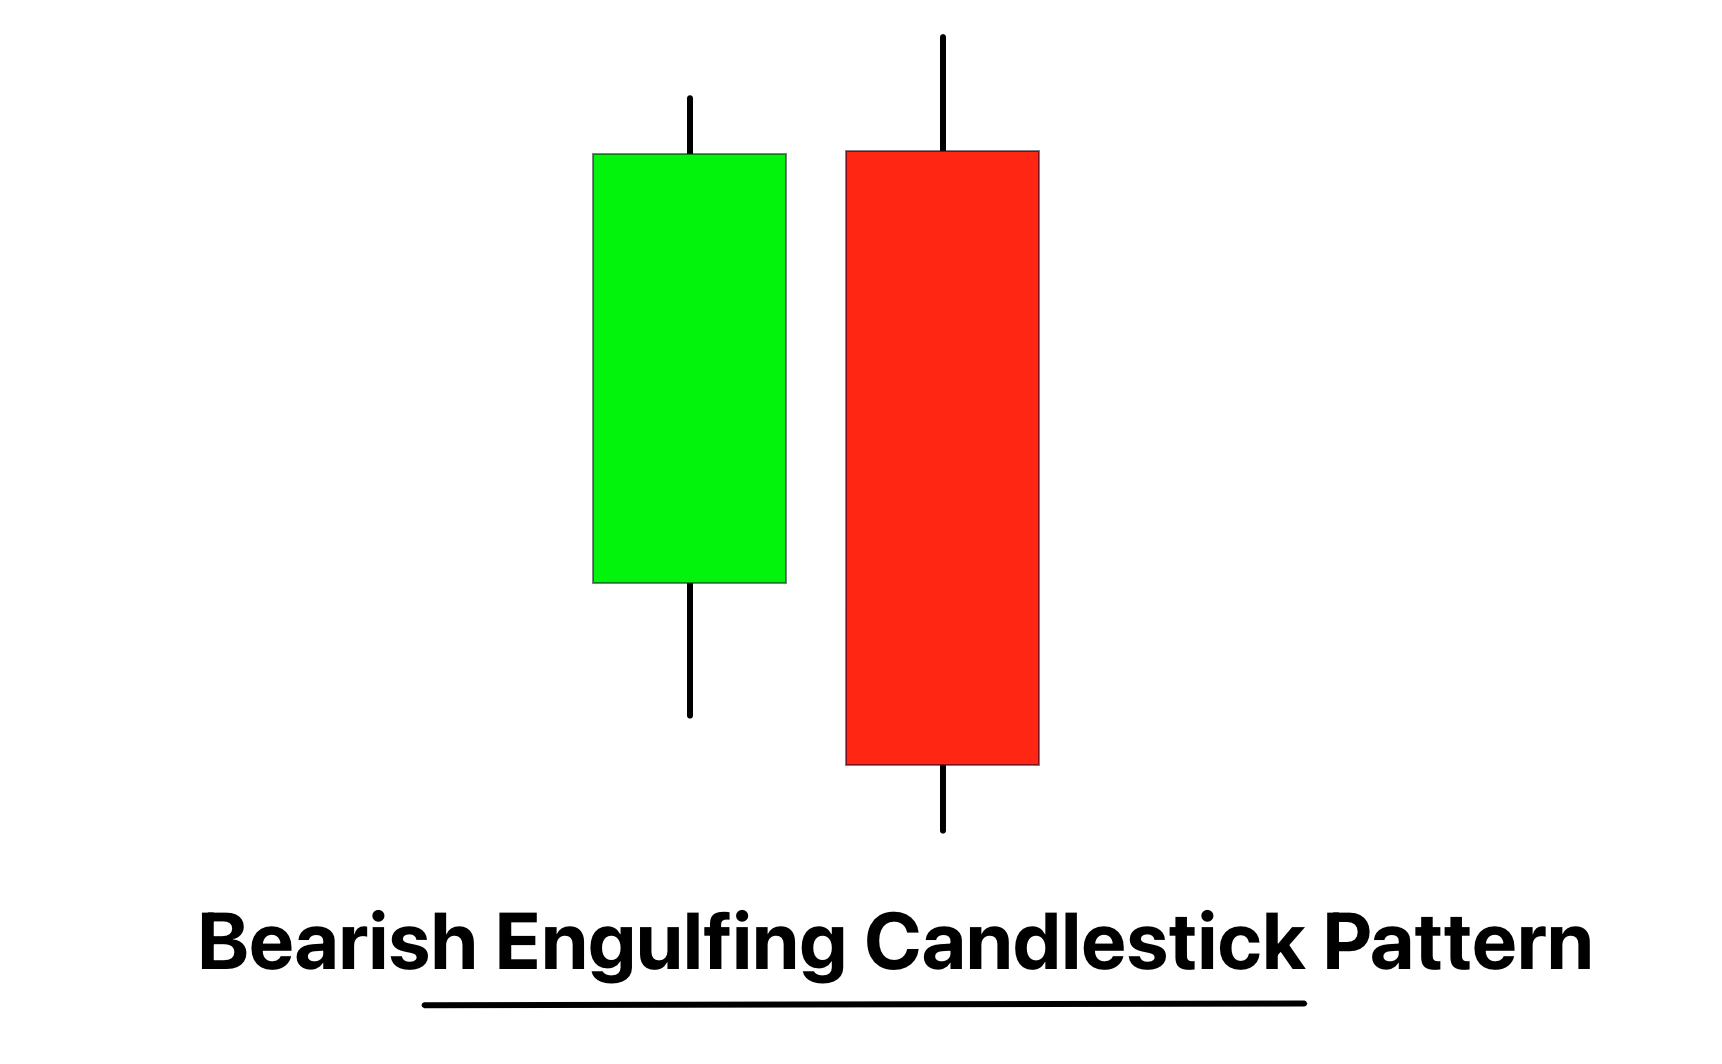
A Bearish Engulfing pattern is a two-candle reversal pattern where a small bullish candle is completely overshadowed by the following larger bearish candle, signaling a potential shift from an uptrend to a downtrend. This powerful tool provides traders a visual representation of a change in market sentiment, potentially heralding a switch from buying to selling pressure.
How to identify the bearish engulfing candlestick pattern?
The Bearish Engulfing pattern is identified on the chart by following these key steps:
- Identify a Preceding Uptrend: This pattern typically signals a reversal of an uptrend, so the first step is to identify a chart with an upward price movement.
- Look for a Small Bullish Candle: The Bearish Engulfing pattern begins with a small bullish candle, which usually represents the last gasp of the bulls in an uptrend.
- Spot a Larger Bearish Candle: The second candle in this pattern is a larger bearish candle. This candle opens at a price higher than the previous candle’s close and closes below the previous candle’s open, engulfing the entire body of the previous candle.
- Confirmation: Traders often seek a confirmation of the pattern, which could be in the form of the next candle closing lower or other technical analysis tools indicating bearish momentum.
Significance
The Bearish Engulfing pattern holds significant value in technical analysis as it provides an early indication of a potential bearish reversal. Here’s what it signifies:
- Change in Momentum: The pattern typically indicates a switch in momentum from bullish to bearish, suggesting that sellers have taken control from buyers. This shift often precedes a downward price movement.
- Strong Selling Pressure: The larger bearish candle ‘engulfing’ the smaller bullish one signifies strong selling pressure. The fact that sellers were able to push the price below the previous candle’s open implies that sellers are now driving the market.
- Market Reversal: The formation of the Bearish Engulfing pattern during an uptrend is often seen as a reversal signal. It suggests that the uptrend could be losing steam and a downtrend might be on the horizon.
- Trading Opportunities: For traders, the pattern presents potential trading opportunities. Once the pattern is confirmed, traders may consider entering a short position, expecting the price to fall.
Psychology of bearish engulfing candlestick
When a Bearish Engulfing pattern forms, it can provide insights into the activities and sentiment of large or institutional traders, which can be invaluable for retail traders seeking to align their strategies with market momentum.
- Shifting Momentum: The formation of a Bearish Engulfing pattern is typically seen as a shift in momentum from the buyers to the sellers. This could imply that large traders are starting to sell or short the asset, leading to the strong bearish candle that engulfs the prior bullish one.
- Profit-Taking: The pattern often forms at the end of an uptrend, suggesting that big players may be taking profits from their long positions. This profit-taking activity can accelerate the bearish move.
- Increased Short Selling: After the formation of a Bearish Engulfing pattern, large traders may increase their short positions, anticipating a downturn. This increase in selling pressure can lead to a sustained downtrend.
- Signaling Market Tops: Often, large traders use this pattern to identify potential market tops. When a Bearish Engulfing pattern forms at a key resistance level or after a prolonged uptrend, it could signal a reversal, prompting institutional traders to exit their long positions or initiate short ones.
Confirmation tools
To increase the reliability of the Bearish Engulfing pattern, you might use several confirmation tools:
| Confirmation Tool | Description |
|---|---|
| Key Resistance Level | If the Bearish Engulfing pattern forms at a significant resistance level, it increases the likelihood of a bearish reversal. |
| Break of Low After Pattern Formation | A break below the low of the engulfing candle after the pattern forms can further confirm the bearish reversal. |
| High Volume | If the bearish candle that forms the engulfing pattern is accompanied by high volume, it suggests strong selling pressure, reinforcing the validity of the reversal. |
Key Aspects
- Best Timeframe: While the Bearish Engulfing pattern can form on any timeframe, its reliability tends to increase on higher timeframes, such as the daily or weekly charts, due to less noise and a larger dataset.
- Trading Session: This pattern can occur in any trading session, including the US, European, or Asian markets. However, its effectiveness is typically higher in sessions with greater liquidity.
- Winning Ratio: The success rate of the Bearish Engulfing pattern can vary based on market conditions and the trader’s skill level. With the proper use of confirmation tools and careful risk management, a winning ratio between 50-60% could be targeted, though individual results may vary.
Trading strategy
Trading strategy involving a Bearish Engulfing pattern and the Moving Average Convergence Divergence (MACD) indicator can be powerful when properly applied. Here is a simple strategy to consider:
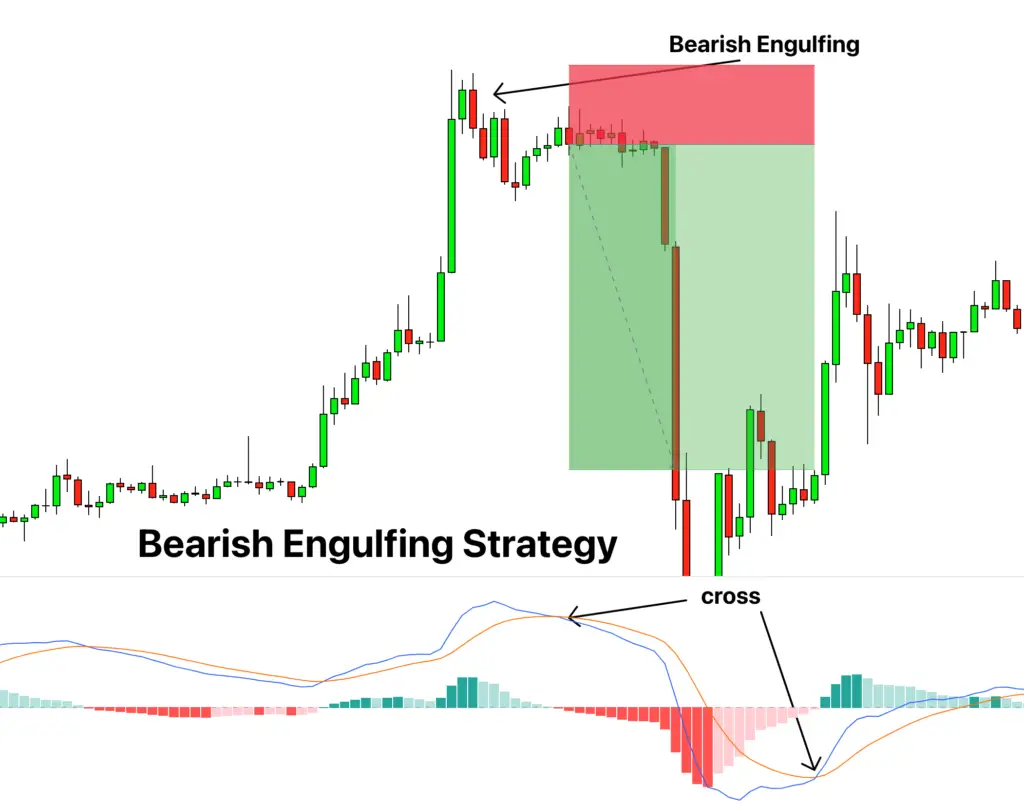
- Identify Bearish Engulfing Pattern: Firstly, identify a Bearish Engulfing pattern forming on the chart in the context of a preceding uptrend.
- Confirm with MACD: Use the MACD to provide further confirmation of the bearish signal. Ideally, you want to see the MACD line crossing below the signal line, indicating bearish momentum. If the MACD cross occurs near the time the Bearish Engulfing pattern forms, it adds to the pattern’s reliability.
- Entry Point: A potential entry point could be as soon as the next candle opens following the confirmation of the Bearish Engulfing pattern and the bearish MACD crossover. Alternatively, some traders might wait for a break below the low of the bearish engulfing candle to further confirm the bearish reversal.
- Stop-Loss: Set a stop-loss above the high of the bearish engulfing candle to limit potential losses if the price reverses. Remember, the stop-loss should take into account the volatility of the asset and your risk tolerance.
- Take-Profit: As for the take-profit level, it can be determined based on a risk-reward ratio that you’re comfortable with. A common approach is to aim for a 1:2 risk-reward ratio, meaning that your potential profit is twice your potential loss.
This trading strategy provides a systematic way to trade the Bearish Engulfing pattern, using the MACD as a confirming tool.
Conclusion
In conclusion, the Bearish Engulfing pattern is a potent technical analysis tool used by traders to identify potential bearish reversals. It can provide valuable insights into shifts in market sentiment, indicating a transition from bullish to bearish momentum.
However, like all trading patterns, it’s essential to remember it’s not foolproof and should be used as part of a comprehensive trading strategy, alongside other technical tools like the MACD, and with appropriate risk management. Understanding the actions of big traders, trading volume, and significant price levels can also enhance the effectiveness of this pattern

