
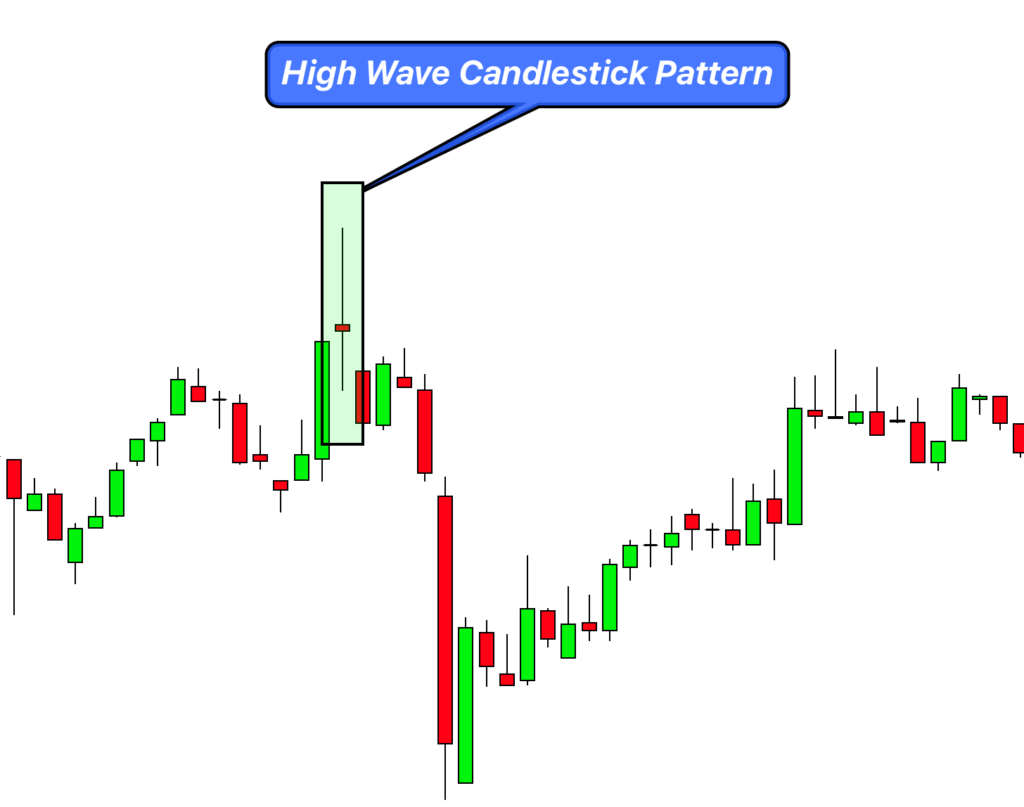
The High Wave candlestick pattern is characterized by a candle with long upper and lower shadows and a small real body, indicating indecision and potential volatility in the market.
In the world of candlestick charting, the High Wave pattern emerges as a beacon of uncertainty, where neither bulls nor bears can gain a decisive edge, often signaling a potential inflection point in the price action.
Identifying the High Wave Candlestick Pattern
- Small Real Body: Look for a candlestick with a diminutive real body. This suggests that there was little difference between the opening and closing prices, indicating indecision.
- Long Shadows: The pattern should have extended upper and lower shadows (or wicks). Both shadows should be significantly longer than the real body of the candlestick.
- Body Position: The small real body can be positioned in the middle, top, or bottom of the range. Its position doesn’t drastically alter the pattern’s meaning, but the exact positioning might provide nuances about the prevailing sentiment.
- Prevailing Trend: While the High Wave pattern can be found in both uptrends and downtrends, its significance and interpretation can be influenced by the direction of the preceding trend.
- Frequency: Unlike some patterns, the High Wave can appear as a solitary candle or can occasionally be found in a series, especially in highly volatile markets.
By spotting the above characteristics, traders can identify the High Wave candlestick pattern and gauge the ongoing tug-of-war between buyers and sellers.
Significance and Indications
1. Market Indecision:
The most glaring insight the High Wave pattern offers is the market’s current state of indecision. With its long shadows and small real body, the candle reveals that both bulls and bears had their moments of dominance during the period, but neither could maintain a stronghold. This push and pull between buyers and sellers frequently precedes pivotal market moves.
2. Potential Trend Reversal:
If the High Wave candle appears after a consistent uptrend or downtrend, it can serve as a warning. The indecision might suggest that the ongoing trend is losing steam and a reversal could be on the horizon. While it’s not a confirmation in itself, the pattern certainly demands heightened alertness from traders.
3. Volatility Ahead:
A series of High Wave candles or even a singular occurrence hints at increased volatility. The market is searching for direction, and this search often leads to sharp price swings. Traders should brace for potential breakouts or breakdowns, adjusting their risk management strategies accordingly.
4. Use in Conjunction:
While the High Wave pattern provides valuable insights, it’s imperative to use it in tandem with other technical tools for validation. The pattern signals potential market moves, but a confirmation, be it through subsequent candle formations or other technical indicators, enhances its predictive power.
In essence, the High Wave candlestick pattern is a manifestation of the market’s internal conflict, a precursor to significant price actions. For traders, it’s a cue to tread with caution, refine their strategies, and stay attuned to ensuing market developments.
Activity of Big Traders During the Formation of the High Wave Candlestick Pattern
1. Testing Waters:
When the High Wave pattern emerges, it often indicates that institutional or big traders are testing the market’s resilience. The extended wicks suggest that they are pushing prices to extremes to evaluate where the substantial buying or selling pressure lies, gauging the market’s true sentiment.
2. Distribution or Accumulation:
The pattern might be a sign that big traders are either distributing (selling) their positions or accumulating (buying) more. The indecision reflected in the pattern could indicate that these large traders are stealthily offloading or gathering positions, causing the price to swing but without a clear direction.
3. Awaiting Catalysts:
Big traders, like everyone else, might be on the fence due to upcoming significant events or announcements. Whether it’s impending economic data, earnings reports, or geopolitical events, institutional traders might be holding back from making decisive moves, leading to the High Wave formation.
4. Hedging Activities:
The indecision and volatility associated with the High Wave pattern can sometimes be attributed to major market players initiating or adjusting their hedging strategies. This can involve a combination of spot market positions, futures, options, or other derivatives.
For retail traders, understanding these underlying dynamics is crucial. It suggests that while the market is showcasing indecision on the surface, big players are actively strategizing behind the scenes.
Confirmation Tools
| Tool | Description |
|---|---|
| Key Levels | Observe if the High Wave pattern forms near significant support or resistance levels. Such confluence can enhance the reliability of the pattern. |
| Volume Analysis | A surge in volume during or after the formation of the High Wave indicates increased interest and validates the pattern’s potential significance. |
| Subsequent Candle | A strong bullish or bearish candle immediately following the High Wave can serve as a confirmation of the impending trend direction. |
| Technical Indicators | Oscillators like RSI or MACD can help identify overbought or oversold conditions, adding another layer of confluence to the pattern’s interpretation. |
Optimal Conditions for Trading the High Wave Pattern
Best Timeframe:
For the High Wave pattern, daily and 4-hour charts tend to be the most reliable. While the pattern can form on any timeframe, these longer durations provide a broader view of market sentiment, reducing the ‘noise’ found in shorter timeframes.
Trading Session:
The High Wave’s significance is heightened during major market overlap sessions, such as the London-New York overlap. This period witnesses increased liquidity and volume, lending more weight to the pattern’s formation.
Winning Ratio:
The inherent nature of the High Wave pattern (depicting indecision) means it’s not as decisive as some other patterns. On its own, its winning ratio can be around 50-55%. However, when used with other confirmation tools, this can increase to approximately 65-70%.
A Confluence-Based Trading Strategy
1. Entry Criteria:
Wait for the High Wave pattern to form near key levels (support or resistance). Once the pattern is identified, use the next candle as your confirmation. If the subsequent candle closes above the High Wave for a bullish setup or below for a bearish setup, that’s your cue to enter.
2. Stop Loss:
For a bullish setup, place the stop loss just below the lowest wick of the High Wave candle. For a bearish setup, place it just above the highest wick.
3. Take Profit:
A conservative approach is to target a risk-to-reward ratio of at least 1:2. If your stop loss is 20 pips, aim for a 40-pip take profit. However, you can also use key levels or technical indicators as dynamic take profit levels. For example, if entering on a bullish setup, consider taking profits near the next significant resistance.
Conclusion
The High Wave candlestick pattern is a reflection of market indecision and can signal potential reversals when used correctly. It’s essential to use this pattern in conjunction with other tools and indicators to increase its reliability. Like all trading strategies, practice in a demo environment and sound risk management are crucial to success.

