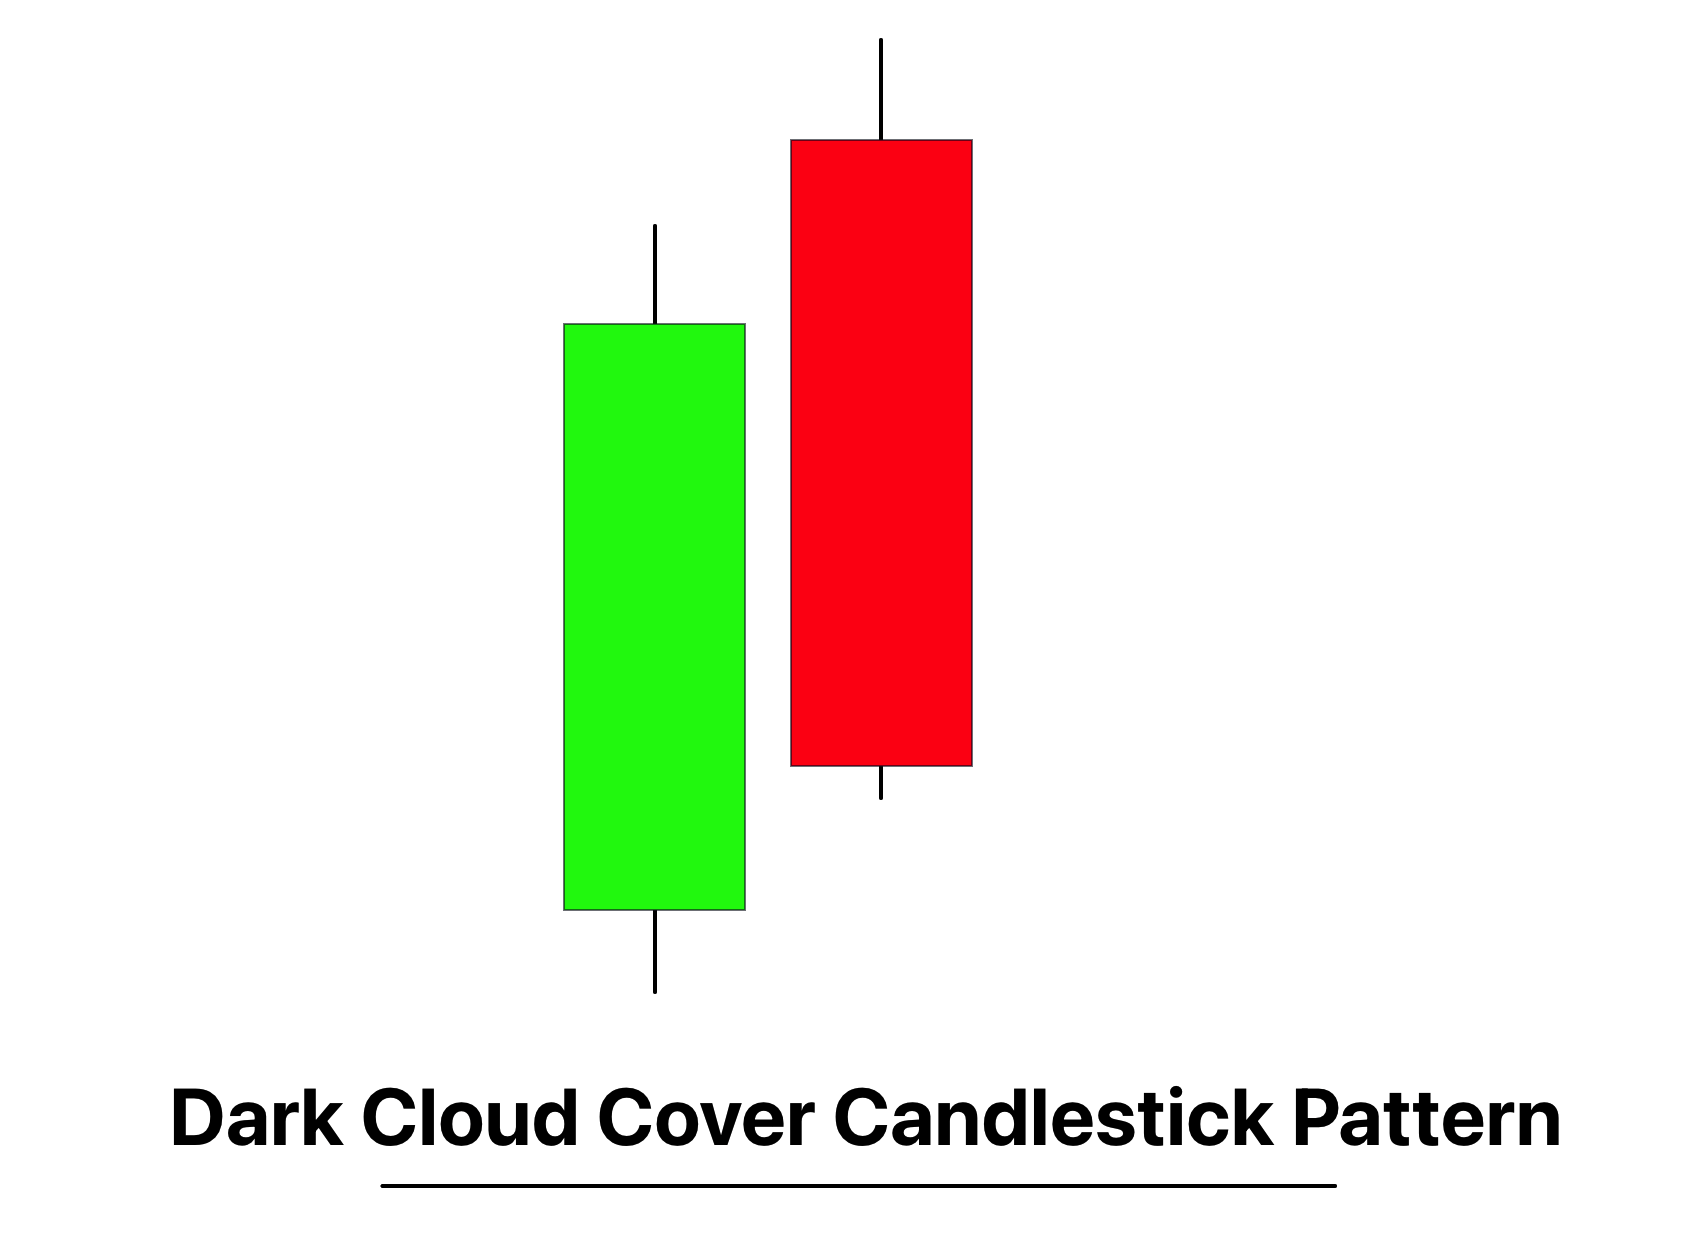
The Dark Cloud Cover is a two-candle bearish reversal pattern that appears at the end of an uptrend, characterized by a long bullish candle followed by a down candle that opens above the high of the first candle and closes within, but not below, the midpoint of the first candle’s body.
As a critical tool in the realm of technical analysis, the Dark Cloud Cover offers traders valuable insights, providing an early indication of potential changes in bullish market sentiment to more bearish sentiment, thus aiding in the decision-making process.
How to find the Dark Cloud Cover candlestick?
here are the steps to follow to identify a Dark Cloud Cover pattern on a chart:
- Identify the Trend: First, you should be able to identify an existing uptrend in the market. The Dark Cloud Cover is a bearish reversal pattern, which means it typically forms after an upward price move.
- First Candlestick: The first candlestick in the Dark Cloud Cover pattern is a bullish (green or white) one that further confirms the ongoing uptrend.
- Second Candlestick: The second candlestick is a bearish (red or black) one. It opens above the high of the first candlestick (bullish), indicating a potential continuation of the uptrend, but then the sentiment changes. The price closes the day below the midpoint of the first candlestick’s body, showing the bears have taken control.
Significance
The Dark Cloud Cover pattern holds significant importance in the realm of technical analysis as it offers a stark depiction of a shift in market sentiment. When this pattern appears after a strong uptrend, it acts as an early warning signal that the trend may be reversing. The initial bullish momentum demonstrated by the first candle starts to falter, and the subsequent bearish candle indicates a strong selling pressure has emerged.
Its significance can be heightened if the pattern is formed near resistance levels, or if accompanied by high trading volumes on the second candle, indicating more active participation in the sell-off. Additionally, if the second candle’s close is further into the first candle’s body, especially if it closes below the first candle’s open, it is considered a more potent bearish signal.
Psychology of dark cloud cover pattern
When a Dark Cloud Cover pattern forms, it can reflect significant activity by larger traders or institutions in the market, and understanding this can provide valuable insights for retail traders.
In the context of an existing uptrend, the first candle of the Dark Cloud Cover is a large bullish candle, showing continued dominance by the buyers, which could include big traders adding to their long positions or covering shorts.
The second candle starts with a gap up, indicating initial enthusiasm and possible continued buying from institutions. However, this enthusiasm wanes and sellers start to dominate during the session, leading to a close that is well into the body of the first candle. This could represent substantial traders taking profits or even opening new short positions, anticipating a potential top.
This swift change from buying to selling pressure can be a signal for retail traders that sentiment is shifting and the uptrend could be nearing its end. As such, it may be wise to tighten stop-loss levels, reduce long exposure, or consider short positions, depending on other confirming signals.
How to find high probability trades with dark cloud cover pattern?
Here’s a table that explains four tools and you should use these in confirming a Dark Cloud Cover pattern and increasing the probability of a successful trade:
| Confirmation Tool | Description |
|---|---|
| Resistance Level | The Dark Cloud Cover pattern is more significant if it occurs at or near a key resistance level or a previously identified supply zone. This suggests the price is having a hard time moving beyond this level, and a reversal might be imminent. |
| Break of Low | Following the formation of the Dark Cloud Cover, a break below the low of the pattern (i.e., the second candle’s low) can serve as a confirmation of a bearish reversal. This shows continued selling pressure and further shift from the prior uptrend. |
| Trading Volume | Higher trading volume on the second (bearish) candle of the Dark Cloud Cover pattern can provide further confirmation. This suggests stronger participation in the sell-off and reinforces the reversal signal. |
| Technical Indicators | Indicators such as RSI or Stochastic oscillator showing overbought conditions, or MACD showing bearish divergence, can strengthen the Dark Cloud Cover’s bearish signal. These tools can help gauge momentum and show whether the bearish reversal is likely to continue. |
Best market conditions for trading the Dark Cloud Cover pattern
Best Timeframe: As a professional trader, you can spot the Dark Cloud Cover pattern on various timeframes, but it is generally more reliable on longer timeframes like the daily, weekly, or monthly charts. This is because longer timeframes tend to filter out the ‘noise’ and give a clearer picture of overall market sentiment.
Trading Session: The Dark Cloud Cover pattern can form during any trading session. However, it’s crucial to note that patterns formed during sessions with higher liquidity, such as the London and New York sessions for Forex or regular trading hours for stocks, tend to be more reliable due to higher trading volume.
Winning Ratio: The success rate of the Dark Cloud Cover pattern is not fixed and varies based on multiple factors including the broader market context and the trader’s ability to effectively use confirmation tools.
The Dark Cloud Cover could have a success rate of around 60-65% when used correctly.
Dark cloud cover trading strategy
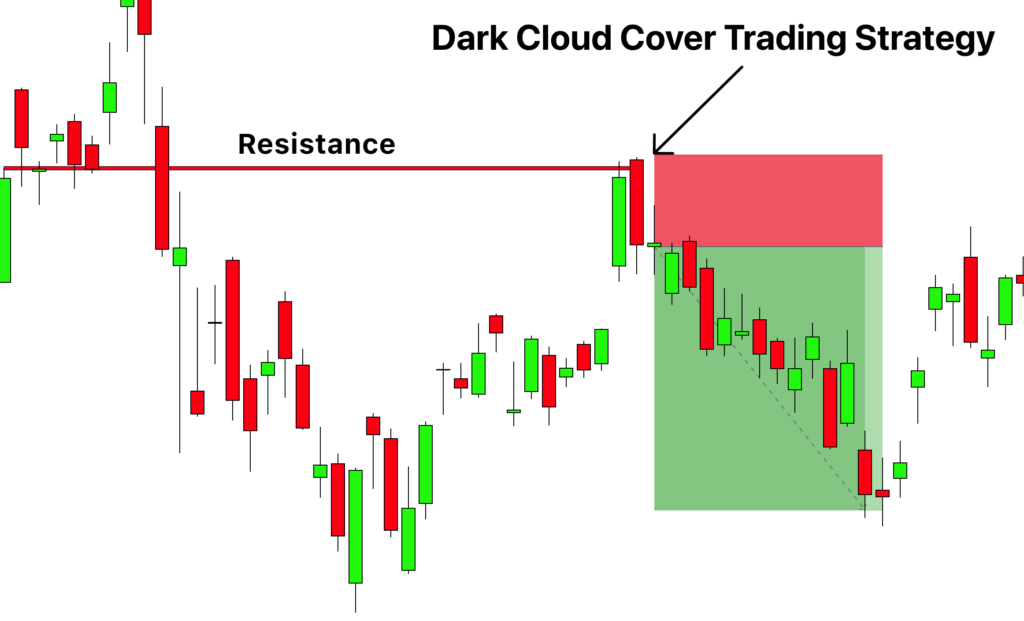
Trading the Dark Cloud Cover involves identifying the pattern, confirming its authenticity, and planning your trade wisely. Here’s a potential trading strategy that incorporates the confluence of a resistance level:
- Identify the Pattern: Look for a significant uptrend followed by a Dark Cloud Cover formation, where the second candle opens above the high of the first candle but closes more than halfway into the body of the first candle.
- Confirmation: The pattern should ideally occur at a significant resistance level. Additionally, the bearish candle should be accompanied by high volume, suggesting strong selling pressure.
- Entry: An aggressive entry would be as soon as the second candle closes. However, a more conservative entry would be upon a break of the low of the Dark Cloud Cover pattern, confirming that the bears have taken control.
- Stop Loss: Place the stop loss slightly above the high of the Dark Cloud Cover pattern. If the price moves above this level, it invalidates the pattern, indicating that the bulls are still in control.
- Take Profit: Look for a prior level of support as the first target for your take profit. This could be a previous swing low or an established support level. For further profit targets, consider using Fibonacci retracement levels or a fixed risk-reward ratio.
Conclusion
The Dark Cloud Cover is a potent bearish reversal pattern that can signal the end of an uptrend, providing a valuable indication for traders looking to take short positions or exit long positions. However, like all trading patterns, it should not be used in isolation. Confirming the pattern with other technical tools like resistance levels, high trading volume, or overbought conditions can increase its reliability and lead to higher-probability trades.
Additionally, the Dark Cloud Cover pattern is more reliable on longer timeframes and during higher liquidity trading sessions. But remember, no pattern guarantees success, and it’s vital to use sound risk management principles at all times. This includes using stop losses, appropriate position sizing, and a disciplined approach to taking profits.

