Definition
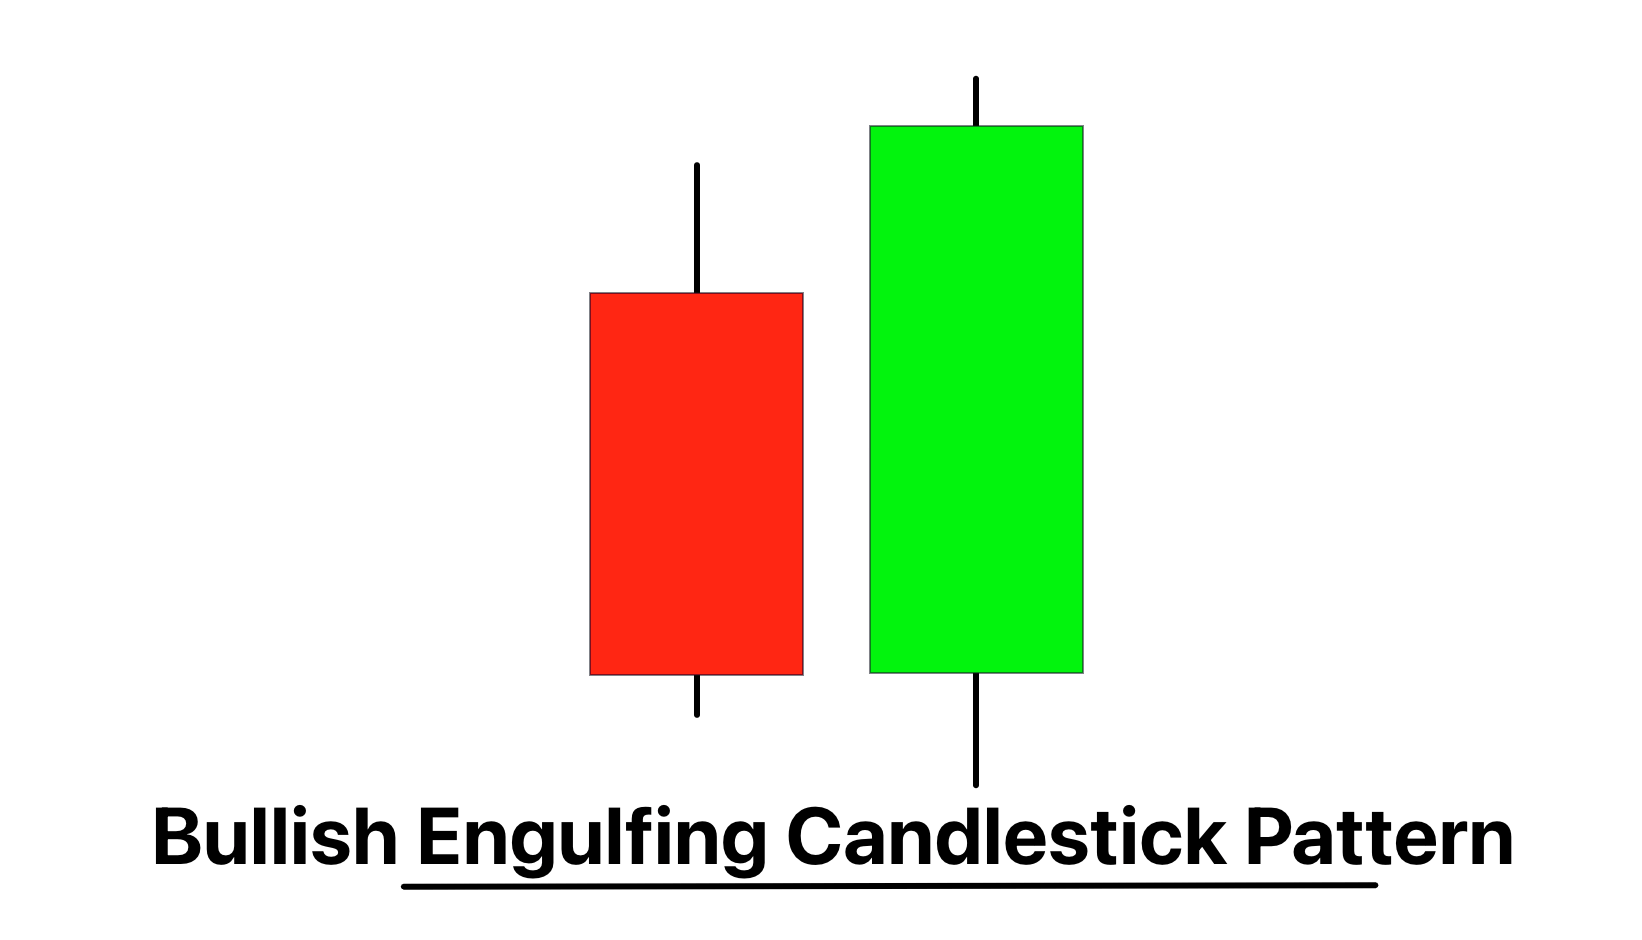
A Bullish Engulfing pattern is a candlestick formation that occurs when a small bearish candle is followed by a larger bullish candle that completely eclipses or ‘engulfs’ the first one, signaling a potential bullish reversal.
As a cornerstone in technical analysis, the Bullish Engulfing pattern provides traders with valuable insights into a shift in momentum, and when utilized accurately, it can significantly improve trading outcomes.
How to identify bullish engulfing candlestick pattern?
Identifying a Bullish Engulfing Pattern involves a few key steps:
- Preceding Downtrend: The pattern typically emerges during a downtrend, signaling a potential reversal. Look for a downward price trend before the formation of the pattern.
- Two-Candle Pattern: The Bullish Engulfing pattern consists of two candles. The first is a small bearish (red) candle followed by a larger bullish (green) candle.
- Engulfing Candle: The second, bullish candle must ‘engulf’ the body of the first candle. That means the open of the bullish candle is lower than the close of the bearish candle, and the close of the bullish candle is higher than the open of the bearish candle.
- Confirmation: Confirmation of the pattern is achieved if the candle following the engulfing pattern closes above the high of the engulfing candle.
By following these steps, traders can identify the Bullish Engulfing pattern on a chart.
Significance
The Bullish Engulfing candlestick pattern carries significant importance in the realm of technical analysis, often utilized by traders to predict potential bullish reversals.
- Indication of Reversal: The pattern emerges during a downtrend and represents a shift in momentum from sellers to buyers. The bullish candle ‘engulfing’ the previous bearish one indicates that buying pressure has overwhelmed selling pressure, suggesting a potential reversal of the downtrend.
- Demonstration of Market Psychology: The Bullish Engulfing pattern essentially paints a picture of the battle between bears and bulls. The bearish candle shows that sellers controlled the trading session initially, but the subsequent larger bullish candle indicates buyers have taken over, reflecting a change in market sentiment.
- Opportunity for Long Entry: The formation of a Bullish Engulfing pattern can serve as a trigger for traders to consider entering long positions or exiting short ones. However, this should be done with due consideration of other technical factors and market conditions to enhance the reliability of the pattern.
- Strength of the Pattern: The strength of the Bullish Engulfing pattern is often gauged by the size of the bullish candle and its position relative to the previous trend. A larger bullish candle engulfing more than one previous bearish candle or forming after a prolonged downtrend often indicates a strong bullish reversal.
- Confirmation: Traders usually seek further confirmation after the pattern appears. This could be in the form of higher trading volumes during the bullish candle formation or a positive price close on the following day, which would solidify the reversal signal.
Activity of traders behind the chart during formation of bullish engulfing candlestick
For retail traders, this change in activity could be a sign to consider opening long positions, as it indicates a possible reversal of the downward trend. However, it’s crucial to monitor subsequent price action for further confirmation. Big traders often employ complex strategies, and a single pattern might not fully capture their overall market strategy.
Additionally, observing the volume during the formation of the Bullish Engulfing pattern can be beneficial. An increase in volume during the formation of the bullish engulfing candle provides further evidence of the involvement of big traders and adds credibility to the potential bullish reversal.
In essence, the Bullish Engulfing pattern can serve as a window into the activities of big traders, helping retail traders in forecasting potential trend changes.
Confirmation tools
The reliability of the Bullish Engulfing pattern can be enhanced when used in conjunction with other technical analysis tools. Below is a table suggesting four such tools:
| Confirmation Tool | Description |
|---|---|
| Key Levels | The pattern gains reliability if it forms at significant support levels, such as historical lows, Fibonacci retracement levels, or major trend lines. |
| Break of High After Pattern Formation | A bullish breakout above the high of the Bullish Engulfing pattern could confirm the reversal signal and indicate that buyers have taken control. |
| High Volume | Volume plays a vital role in confirming the pattern. An increase in volume during the formation of the engulfing candle lends more credibility to the potential bullish reversal. |
| Technical Indicators | The use of indicators like the Relative Strength Index (RSI), Moving Average Convergence Divergence (MACD), or Stochastic Oscillator can provide additional confirmation. For instance, a Bullish Engulfing pattern coinciding with an oversold signal from RSI or a bullish crossover in MACD can strengthen the reversal signal. |
In summary, the Bullish Engulfing pattern provides a potent signal on its own, but its accuracy can be significantly improved when used in tandem with these confirmation tools.
Key points for the best results in trading with bullish engulfing candlestick
- Best Timeframe: The Bullish Engulfing pattern can appear on any timeframe. However, its reliability increases on higher timeframes, like the daily or weekly charts, due to a larger amount of data and less “noise”.
- Trading Session: This pattern can form in any trading session, whether it’s the US, European, or Asian session. The key is to ensure sufficient liquidity during the session, which often correlates with higher reliability of the pattern.
- Winning Ratio: The winning ratio of the Bullish Engulfing pattern can vary significantly depending on the market conditions and the trader’s proficiency. As a general estimate, with proper confirmation tools and prudent risk management, one could aim for a winning ratio between 50-60%.
Trading strategy
Incorporating the Bullish Engulfing pattern into a trading strategy involves careful planning and execution. Here is a simple trading strategy that includes the confluence of a key level:
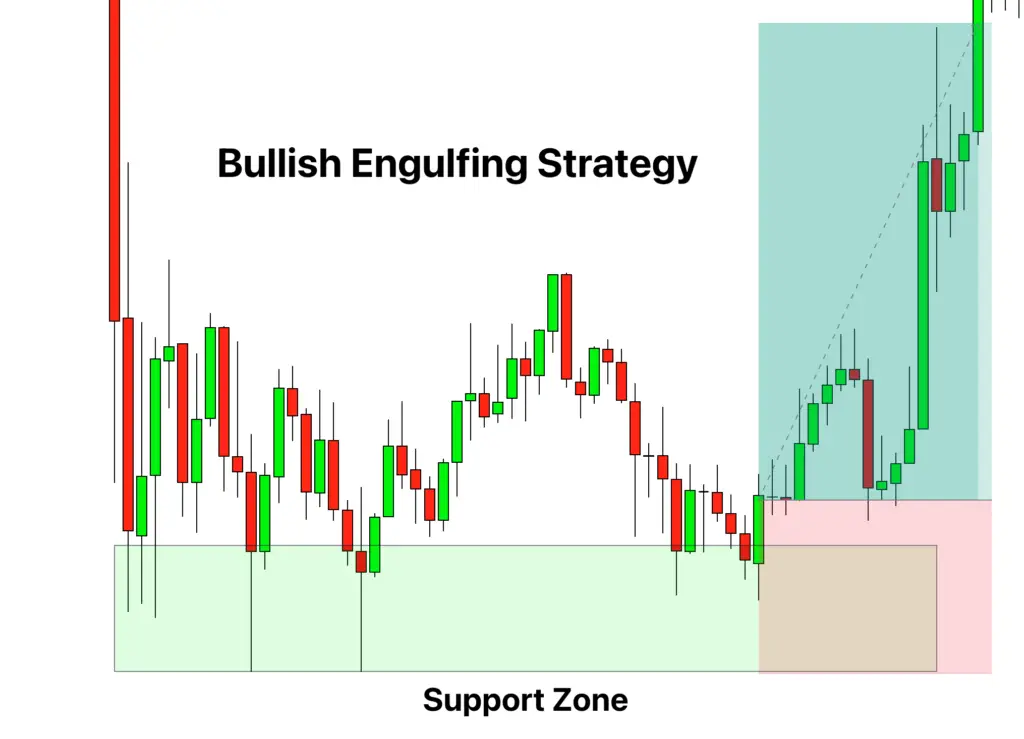
- Identify a Key Level: Start by identifying a significant support level. This could be a historical price level where the asset’s price has previously rebounded, a trendline, or a specific level identified by Fibonacci retracements or pivot points.
- Wait for a Bullish Engulfing Pattern: Once a key level is identified, wait for a Bullish Engulfing pattern to form at this level. This adds to the robustness of the potential reversal, as it involves the confluence of a critical support level and the Bullish Engulfing pattern.
- Entry Point: The entry point is triggered once the Bullish Engulfing pattern forms. However, to further confirm the pattern, you can wait for the next candle to close above the engulfing bar’s high.
- Stop-Loss: Place the stop-loss order slightly below the low of the Bullish Engulfing candle. This placement ensures that if the price reverses and moves in the opposite direction, the trade will be closed to prevent further losses.
- Take Profit: As for the take-profit point, it could be at the next significant resistance level. Alternatively, some traders might use a risk-reward ratio, such as 2:1 or 3:1, to determine their exit point. This means if the stop-loss is 10 pips below the entry point, the take-profit level would be set 20 or 30 pips above the entry point, respectively.
Conclusion
In conclusion, the Bullish Engulfing pattern is a potent technical analysis tool, providing valuable insights into potential bullish reversals in the market. It serves as a sign of a shift in market sentiment, from bearish to bullish, offering an opportunity for traders to enter long positions.

