Definition
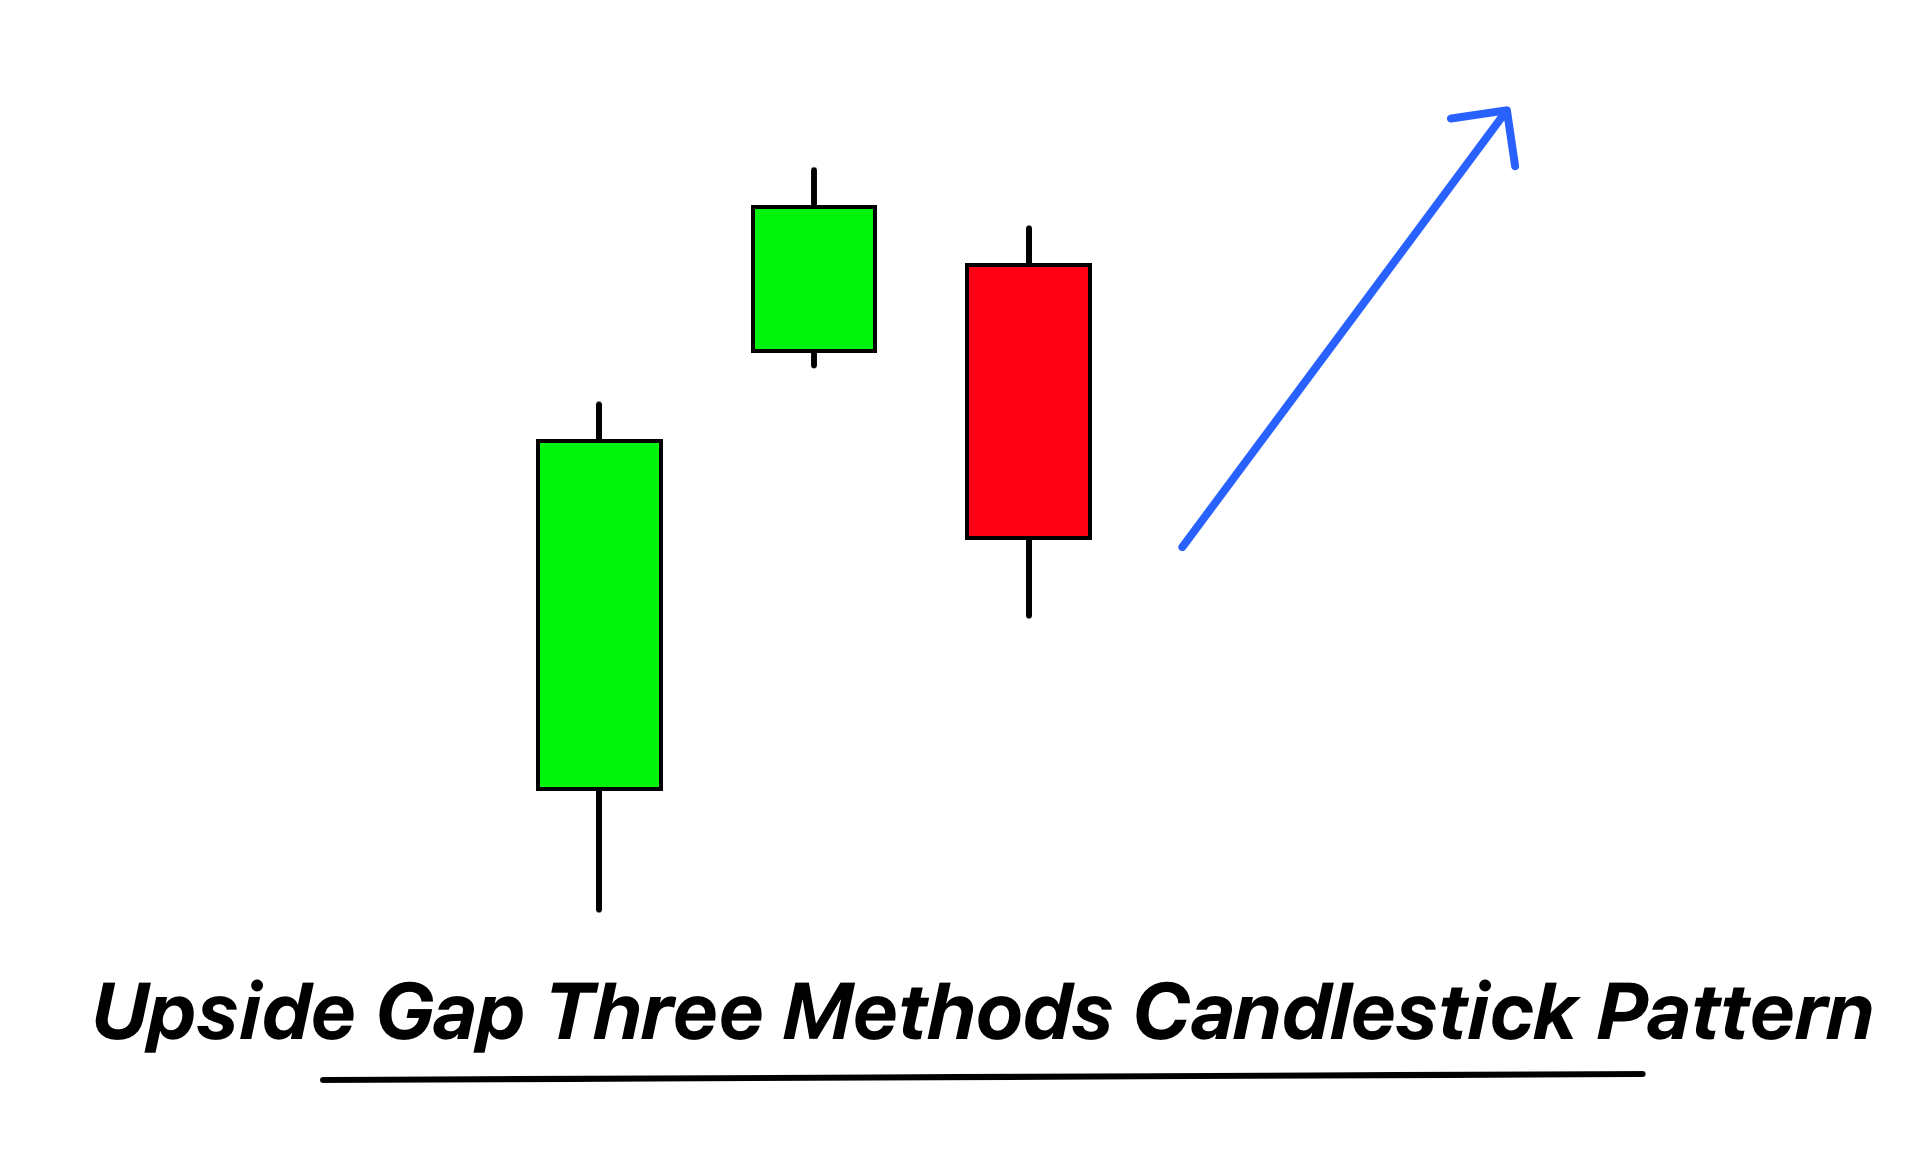
The Upside Gap Three Methods candlestick pattern is a bullish continuation pattern comprised of a long bullish candle, followed by three small bearish candles gapping upward, and ending with a bullish candle that closes within the body of the first candle.
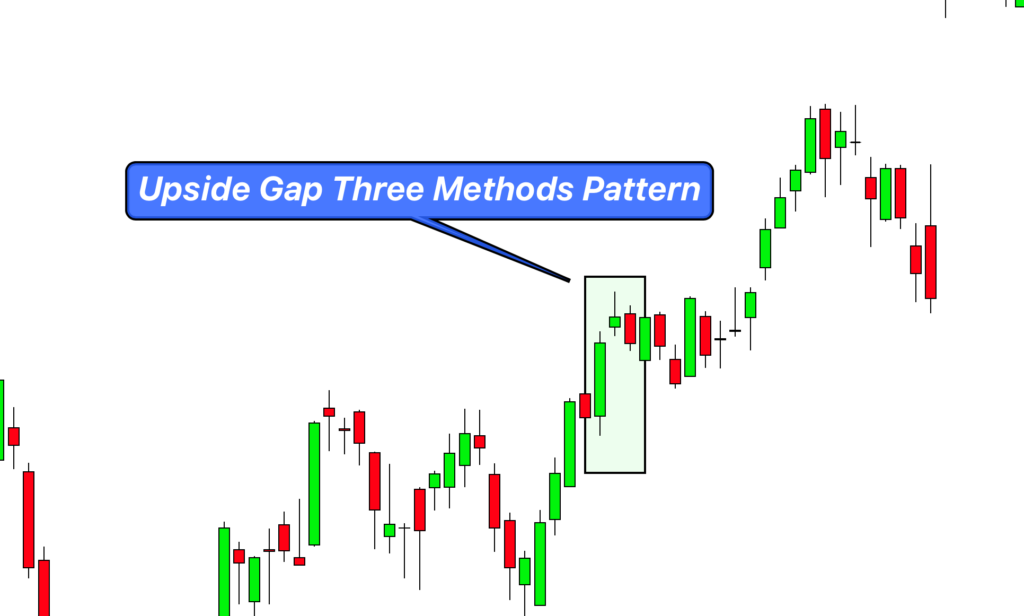
Appearing within an uptrend, the Upside Gap Three Methods pattern signals the persistence of bullish sentiment, hinting that the current upward trend is likely to continue, as the brief bearish interlude fails to disrupt the bullish momentum.
Identifying the Upside Gap Three Methods Candlestick Pattern
- Uptrend: This pattern emerges during an ongoing uptrend in the market. The trend preceding the pattern is of paramount importance, so make sure the market is experiencing a strong bullish phase.
- Initial Long Bullish Candle: The pattern starts with a long bullish (green) candle that suggests strong buying interest.
- Upward Gap: The next three candles, which are small and bearish (red), do not overlap with the preceding bullish candle. Instead, they open with a gap upwards, i.e., their opening prices are higher than the closing price of the preceding bullish candle.
- Third Bearish Candle: The third candle will be a bearish candle with opening within the body of first candlestick and a closing within the body of the second candlestick. This candle indicates a slight sell-off but are unable to reverse the bullish trend.
- Final Bullish Candle: The pattern concludes with a bullish candle that opens lower than the third bearish candle but closes within the body of the initial bullish candle, hinting that the bullish momentum is back in force.
The Significance and Implications
The Upside Gap Three Methods candlestick pattern is a significant indicator in the realm of technical analysis due to its strong predictive capabilities. When it appears during an uptrend, it represents a robust confirmation that the bullish momentum is likely to continue.
This pattern reflects a battle between buyers and sellers where buyers initially show strength (first long bullish candle), sellers attempt a counterattack (three small bearish candles), but eventually, buyers regain control (final bullish candle). The inability of sellers to sustain the downward momentum and close the gap indicates the continuation of the bullish trend.
As a professional trader, seeing this pattern should prompt careful consideration. It’s a clear signal to maintain or increase long positions, taking advantage of the anticipated price increase. However, as with all trading signals, it is prudent to consider this in conjunction with other indicators to confirm the pattern and mitigate potential risks. Always remember to set stop-loss orders to protect against unexpected trend reversals.
Big Traders’ Activity During the Formation of an Upside Gap Three Methods Candlestick Pattern
When the Upside Gap Three Methods candlestick pattern is formed, it is usually an indication of large traders or institutional investors maintaining or bolstering their bullish positions. The presence of this pattern tells us a story about the market’s major players’ behavior.
- Initial Bullish Candle: The initial long bullish candle represents the aggressive buying activity by large traders, pushing the price up.
- Three Bearish Candles: The subsequent three small bearish candles illustrate an attempt by other big players to take profits or establish short positions, causing a minor retracement. However, the fact that these candles start with an upward gap and remain above the close of the initial bullish candle suggests that the bullish big traders are still in control.
- Final Bullish Candle: The final bullish candle, closing within the body of the first bullish candle, indicates the resurgence of the bulls. It’s a sign that large buyers have absorbed the selling pressure and are ready to push the prices higher again.
Confirmation Tools
The Upside Gap Three Methods candlestick pattern, like any other pattern, needs further confirmation to increase its predictive accuracy. Here are four tools you could use:
- Key Levels: Check for the formation of this pattern near key support levels. This could be a historical price level, pivot point, or a notable Fibonacci retracement level. If the pattern forms near such a level, the bullish trend is more likely to continue.
- Break of High After Pattern Formation: Monitor the price action following the pattern formation. A break above the high of the pattern (especially the first bullish candle) can confirm the bullish continuation.
- High Volume: Analyze the trading volume. A higher than average volume on the initial bullish candle and the final bullish candle provides strong confirmation of the pattern. The volume should ideally be lower during the three bearish candles, showing less interest in selling.
- Technical Indicators: Use technical indicators like the Relative Strength Index (RSI), Moving Average Convergence Divergence (MACD), or Stochastic Oscillator. If these indicators show the market being oversold during the three bearish candles and turning to overbought status by the final bullish candle, it could confirm the bullish continuation.
Optimal Conditions
- Best Timeframe: The Upside Gap Three Methods pattern is particularly reliable on higher timeframes, such as the daily (1D) or weekly (1W) charts. These longer periods filter out ‘noise’ and provide a clearer depiction of market sentiment.
- Trading Session: This pattern holds relevance across all trading sessions (Asian, European, and American). However, it might display slightly higher accuracy during the session of the market of the underlying asset, due to the increased participation of big traders.
- Winning Ratio: While it varies based on market conditions and the asset being traded, an Upside Gap Three Methods pattern, when confirmed with additional tools, can offer a winning ratio between 60-70%. Remember, however, that successful trading involves more than just pattern recognition – solid risk management and discipline are also vital.
Trading Strategy with Confluence for Upside Gap Three Methods Candlestick Pattern
- Entry: Enter a long position once the pattern completes with the final bullish candle, especially if the candle closes with strong bullish momentum (high volume). To add confluence, wait for a break of the high of the first bullish candle.
- Stop Loss: Place the stop loss slightly below the lowest point of the three bearish candles. This location allows for market volatility while protecting you if the pattern fails and a reversal occurs.
- Take Profit: The take profit level can be set at a price equivalent to the size of the first bullish candle added to the entry point. For additional confluence, you may also consider significant resistance levels or Fibonacci extension levels.
- Additional Confluence: Incorporate other technical indicators or tools into your strategy. For example, a bullish divergence on the RSI or MACD during the formation of the three bearish candles can add to the confidence in the trade.
Conclusion
The Upside Gap Three Methods candlestick pattern is a powerful indicator of a bullish continuation. However, like any trading pattern, it should not be used in isolation. Combining it with other technical tools can provide stronger, more reliable trading signals. The pattern’s usefulness lies not only in its predictive potential but also in the narrative it provides about market sentiment and the behavior of big traders. As always, effective risk management should be at the forefront of any trading strategy.

