Definition:
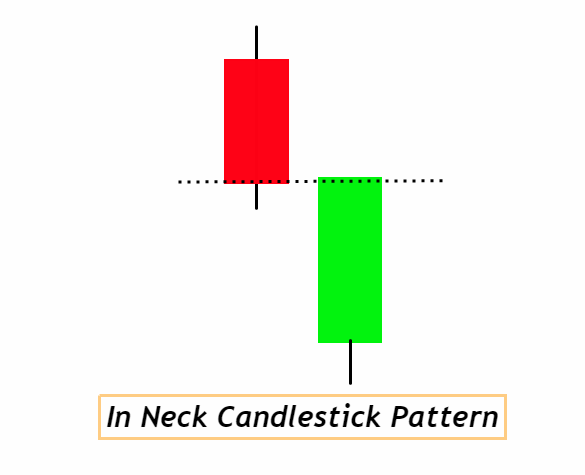
The In-neck candlestick pattern is a two-day bearish continuation pattern where a black candle is followed by a smaller white candle that closes just below the previous day’s close.
Introduction:
Often spotted during downtrends, the In-neck pattern signals that the current bearish momentum is likely to continue.
How to Identify the In-neck Candlestick Pattern on a Chart:
- Trending Context: Look for a prevailing downtrend. This pattern often emerges during bearish market movements.
- First Candle: Identify a black (or red, depending on the chart’s color scheme) candle on the first day. This candle should have a notable body, indicating a clear bearish move.
- Second Candle: The next day should have a white (or green) candle. The body of this candle should be smaller than the first day’s candle.
- Opening Gap: The second candle should open above the close of the first candle, creating a gap.
- Closing Proximity: Despite its upward movement, the second candle should close just below the first day’s closing price, not significantly above it.
- Volume: While not a strict criterion, the pattern is more significant if accompanied by decreasing volume on the second day, emphasizing the continuation of the bearish sentiment.
By recognizing these points on a chart, traders can efficiently spot the In-neck pattern and anticipate potential future movements.
Significance of the In-neck Candlestick Pattern:
- Bearish Continuation: The In-neck pattern primarily signals the continuation of a prevailing bearish trend. When traders observe this formation in a downtrend, it’s an indication that the bearish sentiment is still strong and the trend is likely to persist. The pattern tells traders that despite the modest bullish effort on the second day, bears remain in control.
- Confirmation Tool: For traders looking for confirmation before taking a position, the In-neck pattern serves as a tool to substantiate their bearish bias. When complemented with other technical indicators, such as moving averages or volume, the pattern can be a robust sign that the downtrend is more than just a fleeting phenomenon.
- Risk Management: The In-neck formation can also provide traders with insights for risk management. Upon recognizing this pattern, a trader may opt to tighten their stop-loss levels or consider shorting opportunities, preparing for potential continued downtrends. The clear structure of the pattern, with its characteristic two-candle formation, offers precise points for setting stops.
In essence, the In-neck pattern, while seemingly simple, can be a powerful tool in a trader’s arsenal. It offers clear insights into market sentiment, provides validation for trading strategies, and aids in the formulation of risk management techniques, making it a beneficial pattern for both novice and seasoned traders.
Activity of Big Traders During the In-neck Candlestick Pattern Formation:
- Initial Selling Pressure: The formation of the first black (or red) candle in the In-neck pattern typically signifies substantial selling pressure. This indicates that large institutional traders or “smart money” might be offloading positions, either to lock in profits or in anticipation of a forthcoming decline. Their selling activity is strong enough to push the price down significantly on this day.
- Short-lived Buying Interest: The second day’s white (or green) candle signifies a temporary resurgence of buying interest, possibly due to retail traders seeing perceived value at the lower prices or some institutional traders taking counter-trend positions. However, the fact that this bullish candle fails to close above the previous day’s close suggests that the buying pressure is not substantial.
- Institutional Confirmation: The inability of the second candle to sustain a rally and close above the previous day’s close might indicate that larger traders are using the slight price increase as an opportunity to sell more or initiate new short positions. They understand the market dynamics and often use such minor rallies as chances to get a better price for their bearish bets.
- Volume Analysis: A deeper dive into the volume during these two days can offer more insights. If the first day’s bearish candle has high volume, it’s a clear sign of significant participation by big traders in the selling. If the volume on the second day is reduced, it further signifies that the small bullish move lacks the backing of institutional interest.
For retail traders, understanding these nuances is crucial. Recognizing that the In-neck pattern might represent the strategies and maneuvers of big traders can help them align their positions accordingly, rather than fighting against the dominant flow. In essence, when this pattern emerges, retail traders should be wary of taking long positions, as the “smart money” appears to be betting on further declines.
Confirmation Tools for the In-neck Candlestick Pattern:
| Tool/Indicator | Description |
|---|---|
| Key Levels (Support/Resistance) | If the In-neck pattern forms near a significant support or resistance level, its reliability increases. A pattern near resistance can be a stronger sign of bearish continuation. |
| Break of Low After Pattern | If the price breaks below the low of the pattern, especially the low of the first candle, post-formation, it’s a strong confirmation of bearish continuation. |
| Volume Analysis | High volume on the first candle (selling day) followed by reduced volume on the second day (slight bullish move) strengthens the pattern’s bearish signal. |
| Technical Indicators | Utilizing indicators like the RSI, MACD, or moving averages can offer additional validation. For instance, an overbought RSI or a bearish MACD crossover in conjunction with the In-neck pattern can amplify its bearish implication. |
Traders should remember that combining multiple confirmation tools can enhance the probability of a successful trade. While the In-neck pattern is powerful on its own, these tools can refine entry and exit points, offering a more holistic view of the market’s potential direction.
Optimizing the In-neck Candlestick Pattern for Trading:
Best Timeframe:
The daily timeframe is optimal for trading the In-neck pattern, as it captures significant market sentiment and reduces the noise found in shorter timeframes, such as the 1-hour or 15-minute charts.
Trading Session:
The pattern is most reliable when spotted during the main trading sessions for the asset in question, such as the New York session for U.S. stocks or the London session for major Forex pairs.
Winning Ratio:
While the exact winning ratio can vary based on multiple factors, when combined with the recommended confirmation tools, the In-neck pattern can offer a winning ratio between 60-70%. Traders should always backtest any strategy in their specific market to determine its efficacy.
As with all trading strategies, it’s crucial for traders to maintain discipline, employ risk management techniques, and continuously monitor and adjust their approach based on live market feedback.
Trading Strategy with the In-neck Candlestick Pattern Using Confluence:
- Confluence Factors:
Before making any trade decision, look for additional confluence factors. This could be other technical patterns, key support/resistance zones, trendline touches, or even the convergence of a technical indicator like the RSI or MACD with the In-neck pattern. - Entry:
A potential entry point is when the price breaks below the low of the two-candle pattern, particularly the low of the first candle (bearish day). This break confirms the bearish sentiment and can be a sign to initiate a short position. - Stop Loss:
Place the stop-loss slightly above the high of the second candle (bullish day) of the pattern. This ensures that if there’s a sudden reversal and the market sentiment changes, your loss is minimized. - Take Profit Level:
For setting a take profit, use a 2:1 or 3:1 reward-to-risk ratio based on the distance from your entry to your stop loss. Alternatively, you can look for the next significant support level (if available on the chart) and target it as a potential take-profit zone.
Conclusion:
The In-neck candlestick pattern is a powerful bearish continuation signal, especially when combined with confluence factors. By understanding its formation and the market dynamics behind it, traders can achieve more precise entries, set logical stop losses, and target meaningful profit levels. As with all trading strategies, backtesting and continuous learning are vital to harnessing the full potential of this pattern.

