Definition
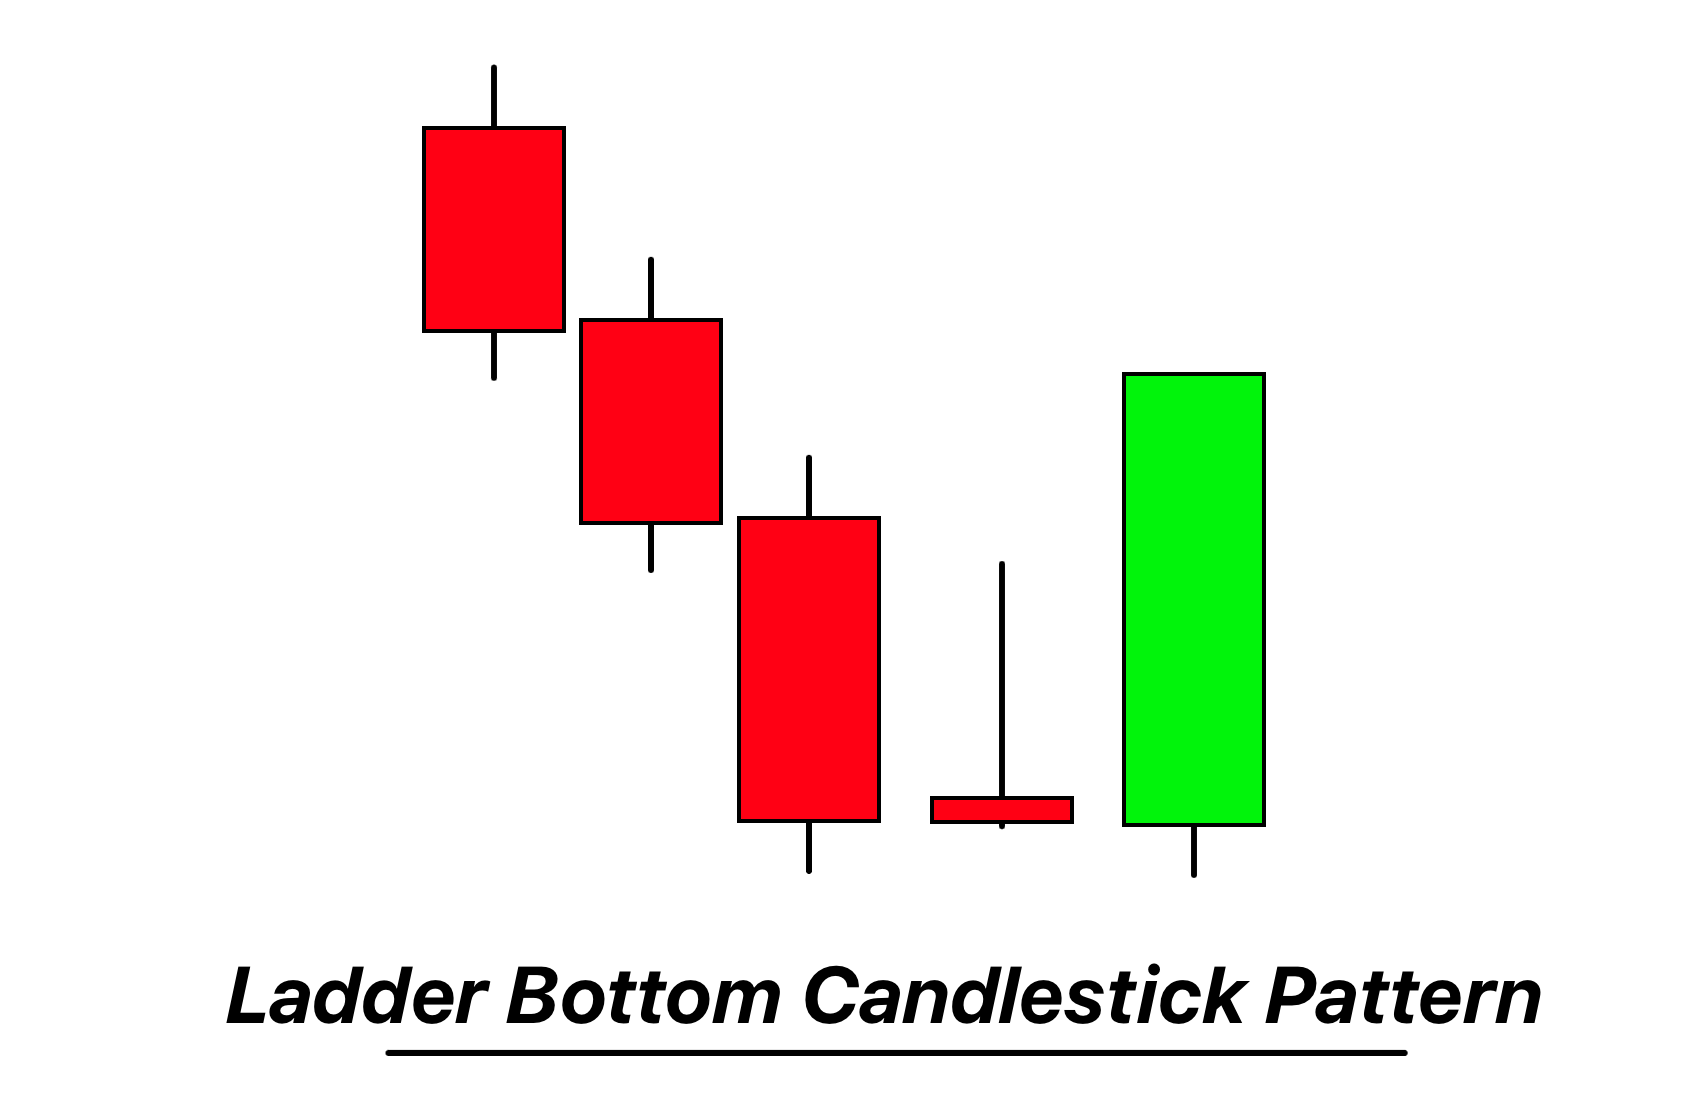
The Ladder Bottom is a five-candle bullish reversal pattern characterized by three consecutive long black (bearish) candles with progressively lower lows, followed by a shorter black candle, and then a long white (bullish) candle that closes above the fourth candle’s close.
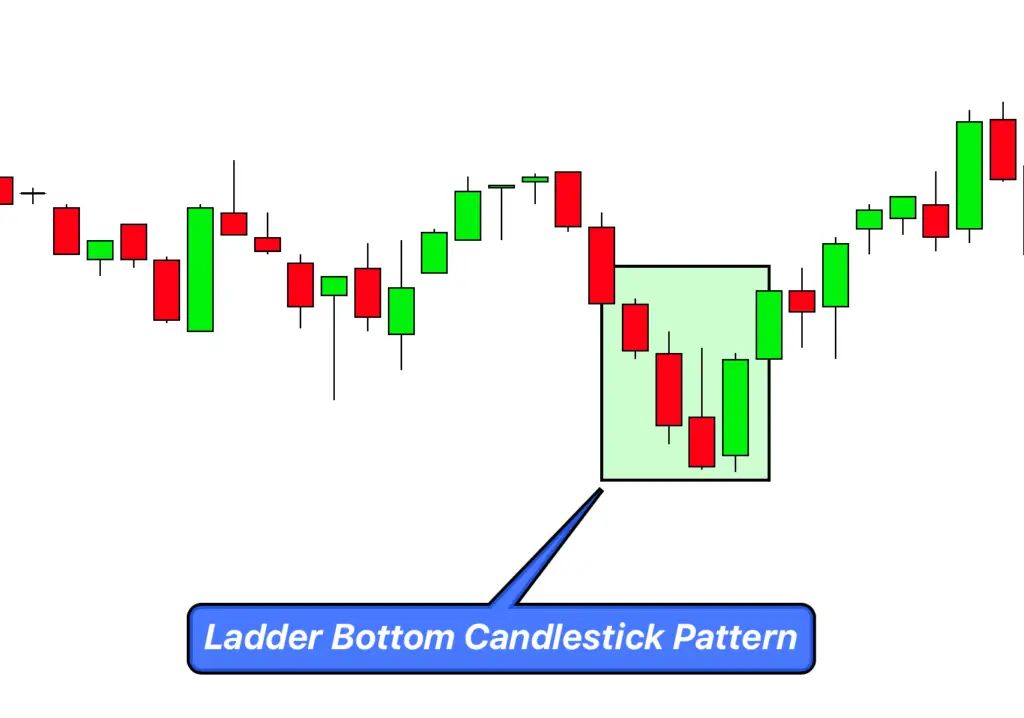
Often appearing at the end of a downtrend, the Ladder Bottom signals a potential shift in sentiment, indicating that bulls are starting to take control after a period of bearish dominance.
How to Identify the Ladder Bottom Candlestick Pattern
- Prior Trend: Begin by looking for a clear downtrend. The Ladder Bottom acts as a reversal pattern, so its appearance should be preceded by a dominant bearish movement.
- Three Long Bearish Candles: The first three candles should be long and bearish (typically black or red), each closing lower than the previous one, illustrating a strong bearish momentum.
- Progressively Lower Lows: The lows of these three bearish candles should be progressively lower, indicating that the bears are pushing prices down with increasing intensity.
- Fourth Shorter Bearish Candle: The fourth candle, while still bearish, should be noticeably shorter than the previous three. Its wick might dip to a new low, but its body remains small, hinting at potential exhaustion among the bears.
- Fifth Bullish Candle: The fifth and final candle in this pattern should be a long bullish candle (typically white or green). It’s crucial that this candle closes above the close of the fourth candle, signifying a shift in control from bears to bulls.
- No Overlap: Ideally, the bodies of these candles should not overlap much, maintaining the distinctiveness of the pattern. Overlapping bodies might weaken the pattern’s reliability.
By meticulously checking for these specific characteristics on a chart, traders can confidently spot the Ladder Bottom pattern, signaling a potential end to the bearish trend.
Significance
1. Sentiment Shift Indication: The Ladder Bottom stands as a testament to a changing tide in market sentiment. The initial trio of bearish candles establishes the dominance of the bears. However, the appearance of the shorter fourth bearish candle hints at waning bearish momentum, and the subsequent bullish candle confirms the shift, highlighting a transition from bearish to bullish sentiment.
2. Bearish Exhaustion Highlight: The reduced size of the fourth candle, after three strong bearish candles, acts as a clear marker of bearish exhaustion. The bears are unable to push the price down as forcefully as before, setting the stage for the bulls to intervene. This transitional moment is key for traders, as it indicates a potential turnaround in price direction.
3. High-Reliability Pattern: While no pattern guarantees success every time, the Ladder Bottom, due to its distinct five-candle structure, is considered relatively reliable. When it does appear, especially after a pronounced downtrend and with other confirming indicators, it offers traders a high-probability hint that the bearish phase might be concluding.
4. Ideal for Risk Management: For new and experienced traders alike, clear patterns like the Ladder Bottom offer valuable checkpoints for risk management. Once this pattern is identified, traders can position their stop-loss orders with more precision, often just below the low of the fifth candle, ensuring a clear exit strategy if the anticipated bullish move doesn’t materialize.
In summary, the Ladder Bottom provides traders with a clear visual representation of a bearish-to-bullish sentiment shift, allowing for more informed decision-making and strategic trade placements.
Behind the Charts: Big Traders’ Activity during the Ladder Bottom Formation
1. Liquidation and Profit-Taking: The initial set of bearish candles in the Ladder Bottom pattern may be driven by big traders (institutional investors, hedge funds, etc.) liquidating long positions or actively shorting the asset. This intensified selling exerts downward pressure on the price, manifesting as the dominant downtrend we first notice.
2. Testing the Waters: By the time the fourth candle forms, these big traders may begin to assess the market’s depth and resilience. The shorter body of this candle can indicate a combination of reduced selling pressure and initial stages of buying interest. It’s akin to testing the waters to see if the asset has reached a level where its valuation is deemed attractive.
3. Entry of Bulls: The final bullish candle is the game-changer. This can often signify institutional buyers stepping in to accumulate positions, having deemed the asset oversold or undervalued. Their significant buying volume can drive prices upward, forming the bullish candle that concludes the Ladder Bottom pattern.
4. The Domino Effect: Once the Ladder Bottom starts taking shape, especially by the fifth candle, other market participants (both big traders and retail) may recognize it. The pattern itself can act as a signal, leading to a cascade of buying activity. Some traders, having previously shorted the asset, may cover their positions to lock in profits, further amplifying the bullish move.
High Probability Confirmation Tools
| Tool | Confirmation Significance |
|---|---|
| Key Support Level | When the Ladder Bottom forms near a significant support level, it enhances the reversal’s credibility. This is because the market is demonstrating respect for historical price levels, and a bounce from such a zone implies stronger bullish conviction. |
| Break of Low Post-Pattern | After the pattern’s formation, if prices remain above the low set by the pattern, it’s a strong bullish sign. However, if prices break below this low, it might indicate potential pattern failure or reduced bullish confidence. |
| Volume Analysis | An increase in trading volume, especially during the formation of the fifth bullish candle, reinforces the pattern’s validity. This uptick in volume signals strong buying interest and the potential for continued upward movement. |
| Momentum Indicators | If momentum-based indicators, like RSI or MACD, showcase bullish divergences or crossover events in tandem with the Ladder Bottom’s formation, they provide additional confirmation of the bullish reversal sentiment. |
Optimal Trading Parameters
Best Timeframe: For the Ladder Bottom pattern, the daily timeframe often provides the most reliable signals. It encapsulates broader market sentiment, minimizing the noise and false reversals that can sometimes plague shorter timeframes like the 1-hour or 15-minute charts.
Trading Session: This pattern holds greater weight when it emerges during primary trading sessions, such as the New York or London sessions. These sessions typically witness higher liquidity and volume, ensuring that the pattern’s formation is supported by substantial market activity.
Winning Ratio: When traded with proper confirmation tools and risk management, the Ladder Bottom pattern can offer a winning ratio in the ballpark of 60-70%.
Ladder Bottom Trading Strategy with Confluence
1. Confluence Factors: Before considering a trade, ensure that the Ladder Bottom pattern is supported by additional confluence factors:
- Support Zones: The pattern gains strength if it forms near established support zones.
- Momentum Divergence: Look for bullish divergences on indicators like RSI or MACD, suggesting weakening bearish momentum.
- Volume Surge: An increased volume on the fifth bullish candle can be an excellent confluence factor, showing strong buying interest.
2. Entry Point: After identifying the Ladder Bottom and confirming it with the above factors, an ideal entry would be on the close or a slight pullback of the fifth bullish candle.
3. Stop Loss: A prudent place for the stop loss would be slightly below the lowest point of the Ladder Bottom pattern. This ensures that if the pattern fails, the trade is exited with minimal losses.
4. Take Profit Level: Targeting a risk-to-reward ratio of 1:2 or 1:3 is a balanced approach. If your stop loss is, for instance, 50 pips below the entry, set a take profit level 100 to 150 pips above. Alternatively, consider trailing your stop or setting multiple take profit levels to capture more potential upside while securing profits.
Conclusion
The Ladder Bottom, while being a compelling bullish reversal sign, gains substantial weight when traded with confluence. It’s the combination of this pattern with other technical cues that can offer traders a high-probability setup. Like all trading patterns, it’s essential to apply disciplined risk management and continual evaluation to maximize success while mitigating potential downside.

