Definition
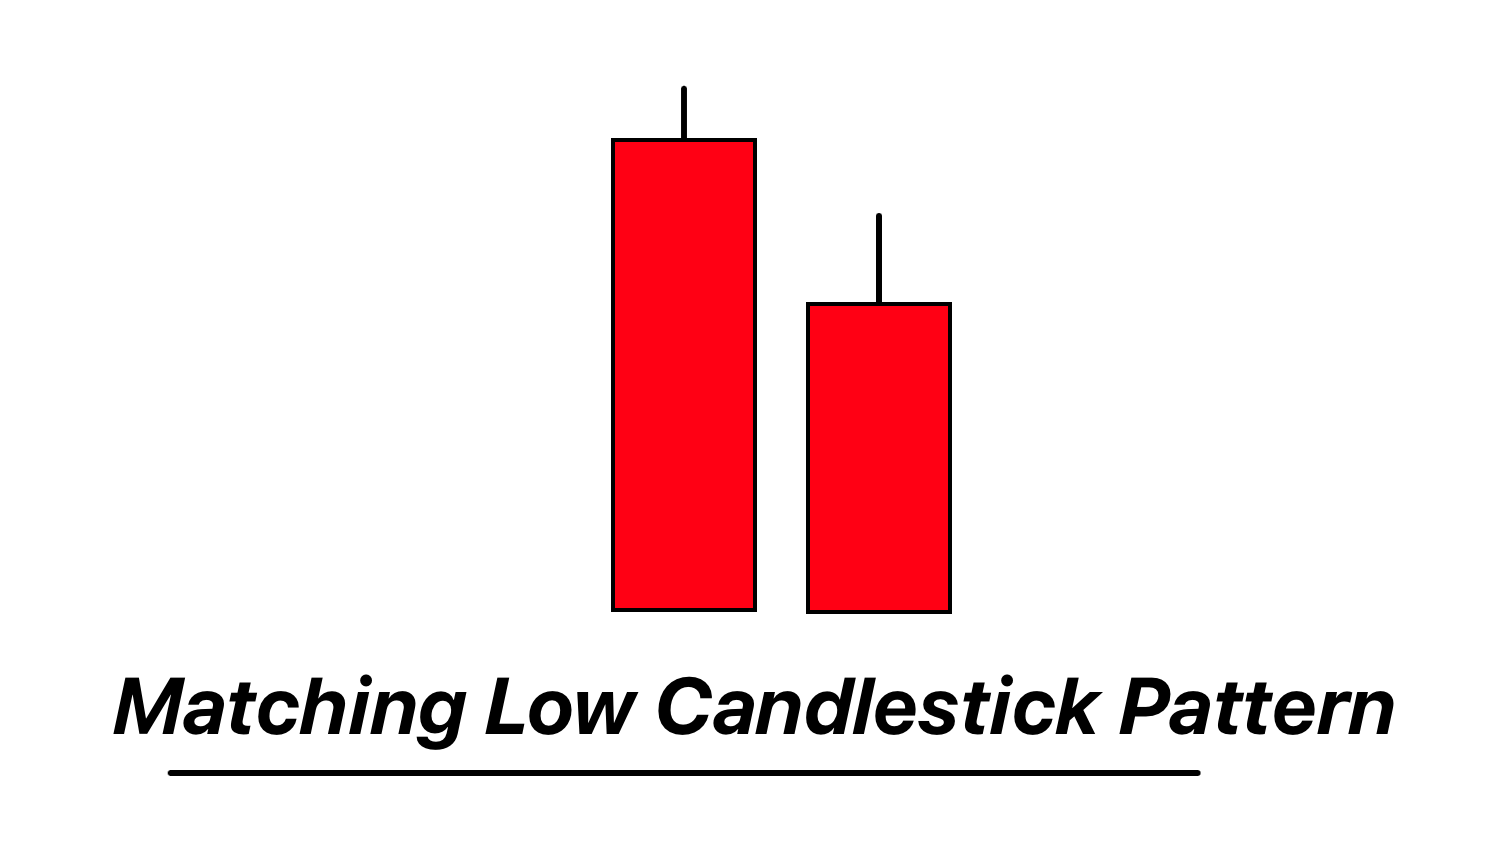
Matching Low is a two-candle bullish reversal pattern where both candles have nearly the same low, but the second candle closes higher than its open.
In a downtrend, the Matching Low pattern signals waning selling pressure, hinting at a potential upcoming bullish momentum.
How to Identify the Matching Low Candlestick Pattern on a Chart
- Downtrend Precedence: Ensure that the pattern is formed within a clear downtrend. This context is important as the pattern signals a potential reversal from this trend.
- First Candle: The first candle should be a bearish candle, ideally with a notable body, confirming the ongoing downtrend.
- Second Candle:
- Opening Gap: The second candle often opens lower than the first candle’s close but doesn’t necessarily have to.
- Similar Lows: Both the first and second candles should have nearly the same lows, hence the name “Matching Low”.
- Bullish Close: The second candle should close higher than its open, indicating potential bullish reversal, though its body can be small or even a doji.
- No New Low: The second candle doesn’t make a new low compared to the first candle, suggesting that selling pressure might be diminishing.
- Volume Consideration (Optional): Higher trading volume on the second day can provide additional confirmation of a potential bullish reversal, as it indicates increased buying interest.
Significance and Indications
1. Selling Pressure Dissipation: When a downtrend encounters a Matching Low pattern, it suggests that the selling pressure, which previously dominated, is beginning to wane. The fact that bears couldn’t push the price significantly lower on the second day is a clear indication of their weakening grip.
2. Potential Bottoming: This pattern often indicates that the market is trying to carve out a bottom. The reluctance of price to set a new low on the second day can be seen as a line in the sand drawn by the bulls.
3. Early Reversal Signal: While the Matching Low doesn’t guarantee a full bullish reversal, it acts as an early warning sign. Professional traders often use it as a cue to tighten stop-loss orders on short positions or to start looking for potential bullish setups.
4. Confirmation is Key: As with many candlestick patterns, the subsequent candles after the Matching Low pattern play a crucial role in confirming the pattern’s implication. A bullish continuation on the following days (like a large bullish candle or a gap up) provides further evidence of a potential trend reversal.
Activity of Big Traders During the Formation of the Matching Low Pattern
1. Positioning and Liquidation: When the Matching Low pattern emerges, it often indicates that institutional or “big” traders are either taking profits from their short positions or initiating new long positions. The absence of a new low on the second day can be a result of these big traders being unwilling to sell at lower levels, indicating their changed perception of the market value.
2. Accumulation: The stabilization at the matching low suggests that larger players might be accumulating positions. This can be inferred from the fact that prices don’t decline further, even after a preceding strong downtrend, hinting at potential buy orders being placed at these levels.
4. Order Flow: For traders with access to advanced tools like Order Flow or Level 2 data, spotting large buy orders around the lows of the Matching Low pattern can offer direct evidence of institutional interest at those price levels.
5. Protective Stops: If the Matching Low pattern is validated with a bullish move afterwards, it can lead to a cascading effect. Many institutional traders might have set protective stops below the lows of the Matching Low, and if those aren’t triggered, it further confirms the pattern’s strength. On the other hand, if prices were to breach the matching lows, it could trigger these stops, leading to a swift move downwards.
6. Price Manipulation Caution: It’s worth noting that, sometimes, large traders may attempt to manipulate price to give a false impression of a market bottom, only to drive prices lower afterwards. Thus, while the Matching Low pattern offers valuable insights, it should be used in conjunction with other tools and indicators for confirmation.
Confirmation Tools
| Tool/Indicator | Description & Use |
|---|---|
| Key Support/Resistance Levels | If the Matching Low forms at a known historical support level, it bolsters the pattern’s credibility. Major support zones can act as a cushion, providing a logical area for reversals. |
| Break of Low After Formation | A breach below the matching lows soon after the pattern suggests the bullish reversal might be invalidated. It’s a strong signal that the pattern may fail and the downtrend could continue. If prices remain above the lows, it confirms the pattern’s strength. |
| Volume Analysis | A surge in volume on or after the second day of the pattern indicates strong participation, often suggesting institutional buying or short-covering. High volume can be a strong confirmation of the pattern’s bullish implications. |
| Moving Averages | If the pattern forms around significant moving averages (like the 50 or 200-day MA), it can act as additional confirmation. For instance, a Matching Low forming just above a rising 200-day MA can be seen as a bullish sign. |
Optimal Conditions
Best Timeframe: Daily and 4-hour charts are most suitable for the Matching Low pattern, offering a balance between signal reliability and trading frequency.
Trading Session: This pattern is best traded during the major market sessions, such as the London or New York sessions, when liquidity and institutional participation are at their peak.
Winning Ratio: Depending on market conditions and confluence with other tools, a well-executed Matching Low strategy can offer a winning ratio of approximately 60-65%. However, individual results can vary, and it’s essential to backtest and adapt based on one’s trading environment.
Matching Low Pattern Trading Strategy with Confluence
1. Confluence Factors:
- Support Zones: Check if the pattern forms at strong historical support levels or major Fibonacci retracement levels.
- Indicators: A bullish divergence on oscillators like RSI or MACD can bolster the reversal signal. Similarly, if the pattern forms around significant moving averages (e.g., 50 or 200-day MA), it adds weight to the bullish setup.
- Volume: An increase in volume during or after the pattern provides further confirmation of potential reversal.
2. Entry:
- Enter a long trade after the close of the second candle, especially if it is followed by a bullish candlestick or gap up.
3. Stop Loss:
- Place the stop loss just below the matching lows of the pattern. This ensures you exit the trade if the pattern is invalidated and the price continues downward.
4. Take Profit:
- For a conservative target, aim for a 1:2 or 1:3 risk-to-reward ratio based on your stop loss.
- Alternatively, if trading in the context of a larger trend or pattern (like a double bottom or trend line bounce), set the take profit near the previous high or significant resistance level.
Conclusion
The Matching Low pattern, when used in conjunction with other confluence factors, offers a potent signal for potential market reversals. While it provides a structured framework for entries and exits, it’s essential to trade it within the context of the broader market environment and always manage risk appropriately.

