Definition
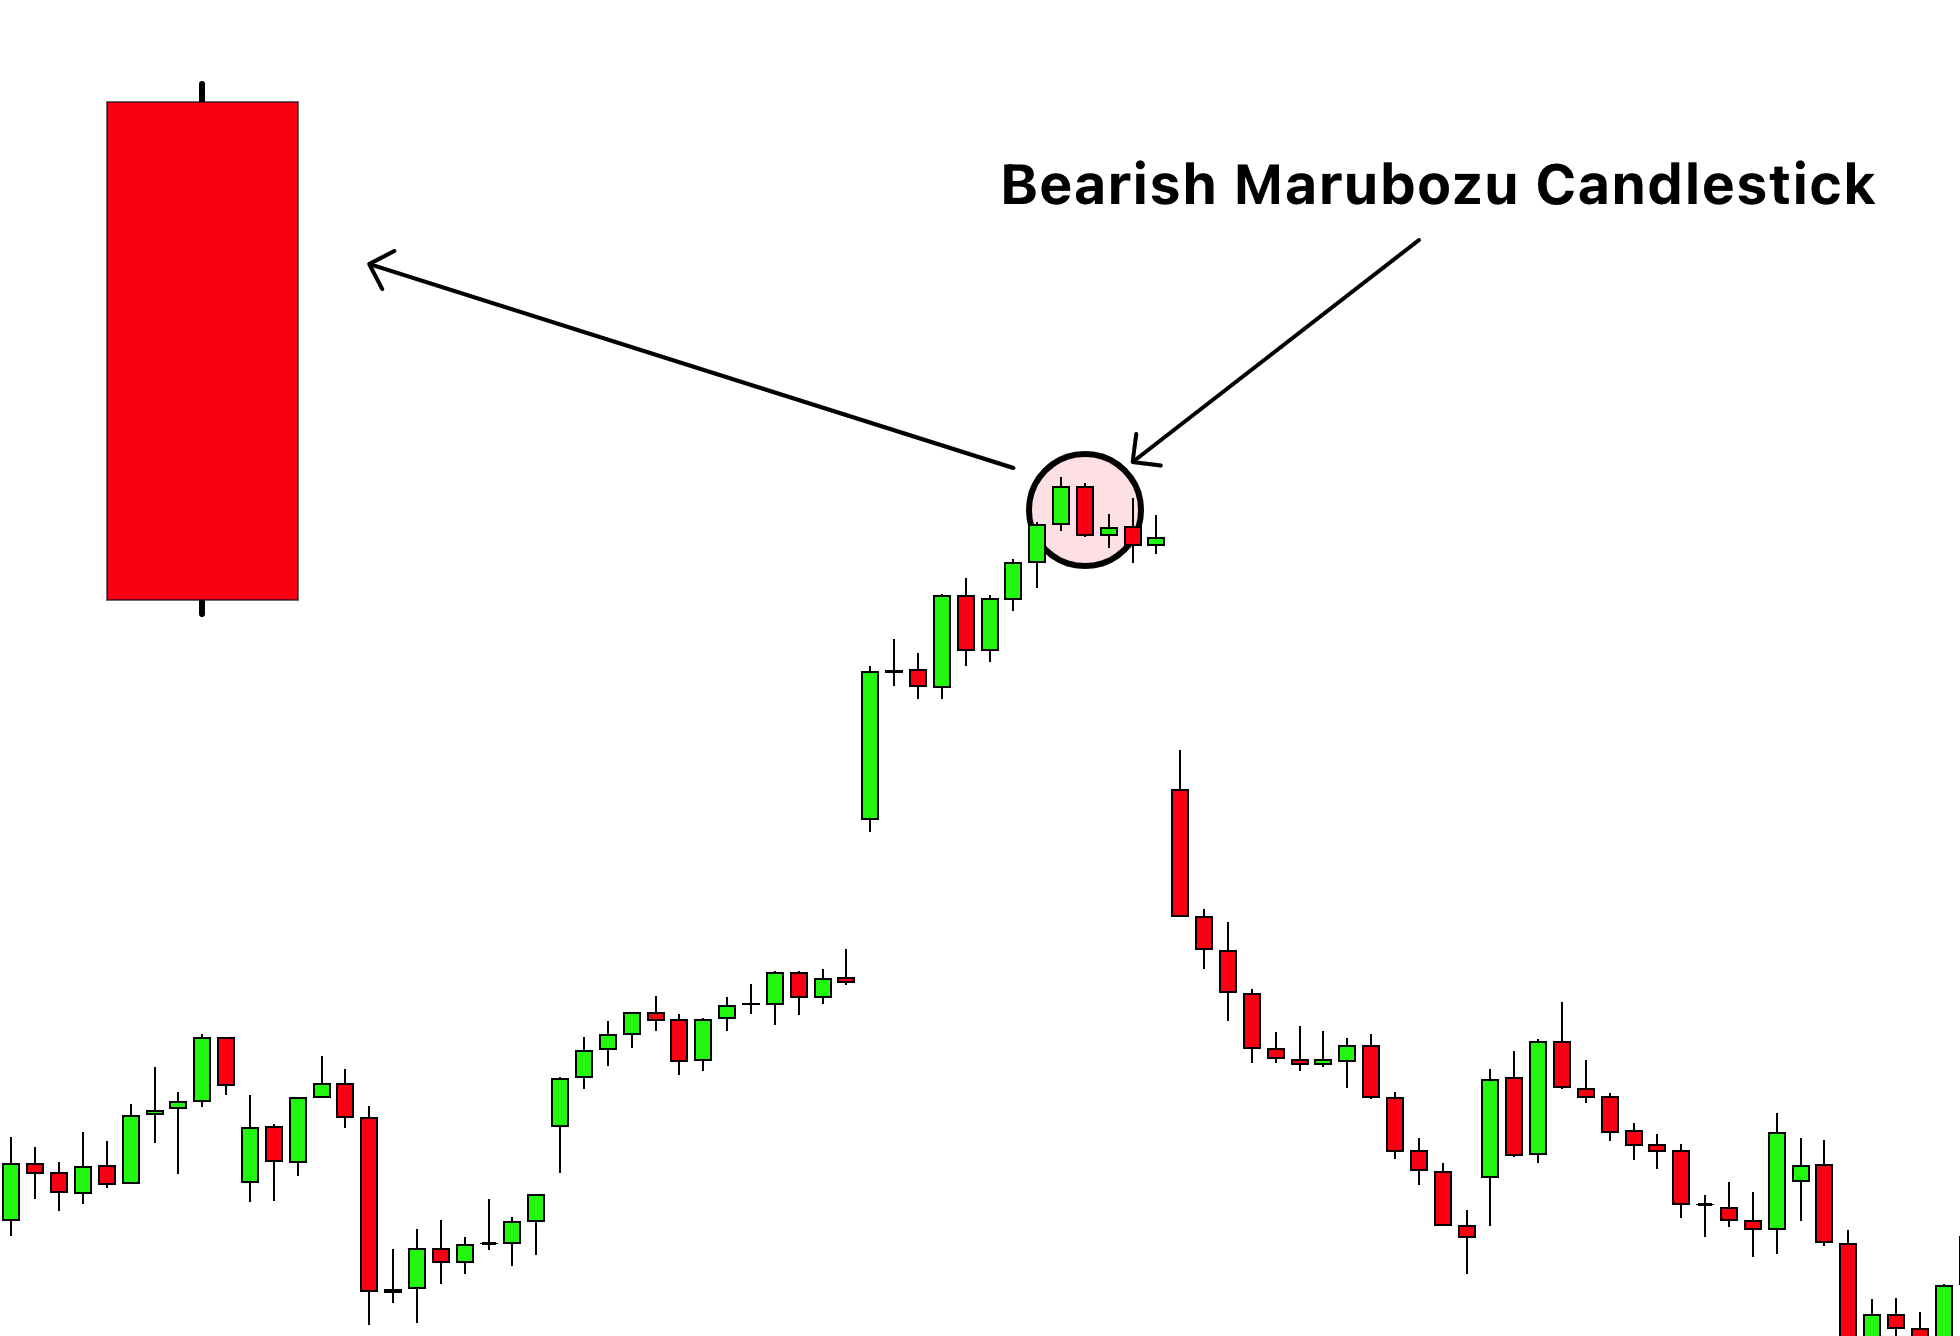
The Bearish Marubozu is a type of candlestick pattern used in technical analysis. “Marubozu” in Japanese means “bald head” or “shaved”, which is reflective of the pattern’s appearance.
The Bearish Marubozu is a significant candlestick pattern in technical analysis, indicative of a trading period where sellers were dominant, pushing the prices lower from the opening to the closing bell.
How to Identify the Bearish Marubozu Candlestick Pattern?
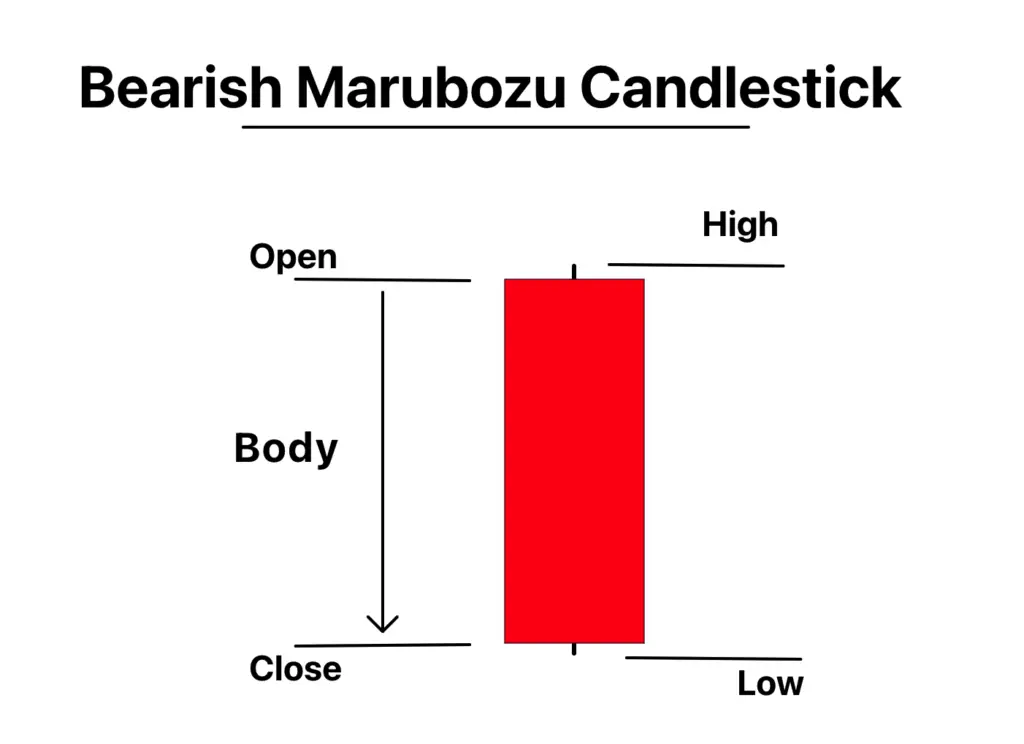
A Bearish Marubozu candlestick is characterized by a long, solid body with little to no wicks (or shadows) at either end. The lack of wicks indicates that sellers controlled the price action from the opening to the closing of the market period. Here’s a breakdown:
- Open: The open price is the high price for that period, which means the asset opens at its peak and then starts declining.
- Close: The close price is the low price for that period, indicating that selling pressure continues to push the price down till the close of the trading period.
- Body: The body of the candlestick, which is the difference between the open and close price, is filled (usually colored in or dark), representing a decline in price.
- Wicks: Ideally, there are no upper or lower wicks, meaning the open price was the high and the close price was the low. However, in practice, a small wick is often tolerated.
This pattern is typically interpreted as a bearish signal, suggesting strong selling pressure. It can indicate either the continuation of a downtrend or the start of a new downtrend. Like all candlestick patterns, it should be used in conjunction with other indicators or tools for confirmation.
Significance and Importance of Bearish Marubozu
The Bearish Marubozu candlestick is a significant pattern in technical analysis because of the clear message it sends about market sentiment: sellers are in control. The absence of wicks indicates that from the opening to the closing of the market, sellers were able to push the price down and keep it there, showing strong bearish sentiment.
The appearance of a Bearish Marubozu can signal the continuation of an existing downtrend, which can be useful for traders looking to ride the momentum of the market. If it appears after a prolonged uptrend, it could indicate a potential trend reversal, alerting traders to an opportunity to potentially profit from falling prices.
Activity of Traders behind the chart
The formation of a Bearish Marubozu candlestick reflects a period of strong selling pressure. Here’s what might be happening behind the scenes:
- At the Open: The period starts, and the opening price is also the highest price of the period. This could be due to a variety of factors, such as leftover bullish sentiment from the previous period, or news or events that initially drive the price up.
- During the Period: After the open, sellers step in and start to dominate the market. This could be institutional investors deciding to sell off a significant portion of their holdings, or traders reacting to bearish news or market signals. The price begins to decline and continues to do so throughout the period, with buyers unable to push the price back up.
- At the Close: By the end of the period, the selling pressure has not let up, and the closing price is also the lowest price of the period. This suggests that sellers were in control from start to finish, and that they might continue to be in control into the next period.
The Bearish Marubozu is a clear sign of bearish sentiment, but it’s important to remember that the reasons behind this sentiment can be varied. It could be due to a negative earnings report for a stock, bearish economic data for a currency, or any number of other factors.
How to find high probability bearish marubozu?
To increase the probability of a successful trade, it’s important to look for additional signs of bearishness before trading based on a Bearish Marubozu candlestick. Here are some factors you could consider for confirmation:
| Confirmation Factor | Description |
|---|---|
| Bullish Prior Trend | A Bearish Marubozu can be a strong signal of a bearish reversal if it appears during an existing uptrend or at a resistance level. |
| High Trading Volume | A higher trading volume during the formation of the Bearish Marubozu can strengthen the bearish signal, indicating strong selling conviction. |
| Bearish Next Candlestick | The appearance of another bearish candlestick or a gap down after the Bearish Marubozu can reinforce the bearish signal. |
| Bearish Technical Indicators | Confirmation from other technical indicators, such as a bearish moving average crossover, a bearish MACD crossover, or an overbought RSI turning down, can add to the reliability of the Bearish Marubozu signal. |
Remember, the Bearish Marubozu, like all technical analysis tools, should be used in conjunction with other indicators and tools to confirm signals and manage risk. Always test any strategy in a simulated or paper trading account before using it in a live trading environment.
Timeframe and trading session
The Bearish Marubozu pattern can be effective across various timeframes, but it’s often considered more significant on longer timeframes such as the daily or weekly charts. This is because longer timeframes can help filter out market noise and provide a clearer view of overall market sentiment.
As for trading sessions, it largely depends on the specific market you’re trading. For forex markets, the overlap periods between major markets like London and New York often provide higher liquidity and volatility. For stock markets, the regular trading hours of the respective exchange are most relevant.
Bearish Marubozu Trading Strategy
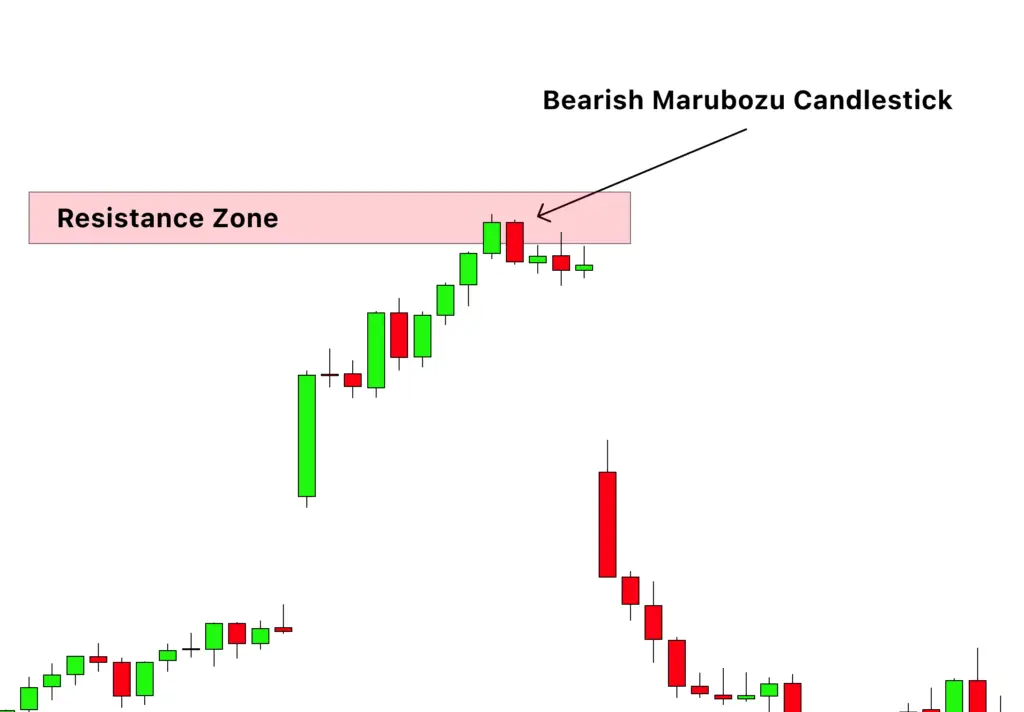
Trading a Bearish Marubozu candlestick pattern in confluence with a resistance or supply zone can be an effective strategy.
- Identify a Resistance or Supply Zone: Look for an established resistance or supply zone on your chart. This could be a historical price level where the asset’s price has struggled to go beyond, indicating strong selling interest.
- Wait for a Bearish Marubozu: Wait for a Bearish Marubozu candlestick to form at the identified resistance or supply zone. The formation of this pattern at a resistance or supply zone can be a strong bearish signal, as it indicates strong selling pressure at a price level where sellers have stepped in before.
- Confirm with Other Indicators: Use other technical indicators to confirm the bearish signal. For example, you might look for bearish signals from the RSI, MACD, or moving averages.
After Confirming the signal, here’s how you might set your entry, stop loss, and take profit:
Entry: Enter the trade after the Bearish Marubozu closes. The confirmation of a Bearish Marubozu at a strong resistance or supply level with additional confirming indicators provides a good entry point.
Stop Loss: Set a stop loss just above the resistance level or the high of the Marubozu candlestick. This protects you in case the price reverses and breaks up through the resistance level.
Take Profit: Your take profit level will depend on your personal risk/reward ratio and your analysis of the market. One common approach is to look for the next significant support level as your initial take profit level, as this is a price level where the asset may face buying pressure. You could also use a trailing stop to capture more profit if the price continues to fall.
it’s important to practice good risk management and to test any new strategy in a simulated environment before risking real money.
Conclusion
The Bearish Marubozu is a highly relevant candlestick pattern for traders, indicating strong selling pressure in a market period. Recognizing this pattern can provide traders with potential opportunities to enter a short position or exit a long position.
However, as a beginner, it’s important to remember that no single pattern should be used in isolation. Always use the Bearish Marubozu in conjunction with other technical analysis tools and indicators for confirmation.
Furthermore, consider the overall market context, including the prevailing trend and key support and resistance levels. Lastly, always practice good risk management, which includes setting appropriate stop loss and take profit levels, and never risk more than a small percentage of your trading capital on any single trade.
Practice and patience are key in becoming proficient in recognizing and effectively trading this and other candlestick patterns.

