Definition
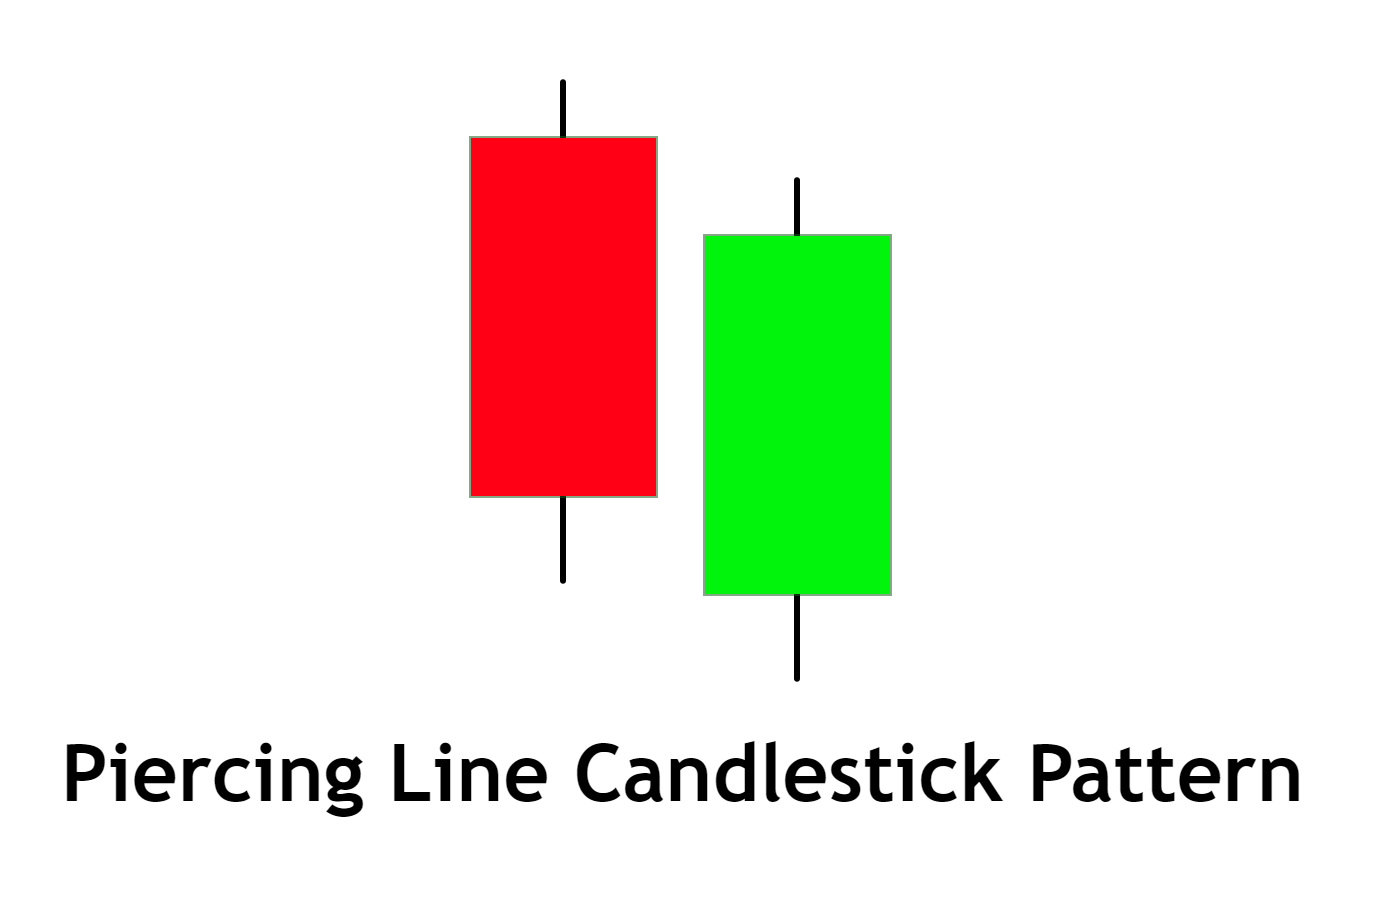
The Piercing Line is a bullish reversal candlestick pattern consisting of two candles: a long bearish candle followed by a long bullish candle that opens below the prior close and closes above the midpoint of the first candle’s body.
This pattern can be a useful tool for traders seeking to identify shifts in market sentiment, especially when used in conjunction with other technical analysis methods.
Identifying the Piercing Line Candlestick Pattern on a Chart
Traders can identify the Piercing Line pattern using the following criteria:
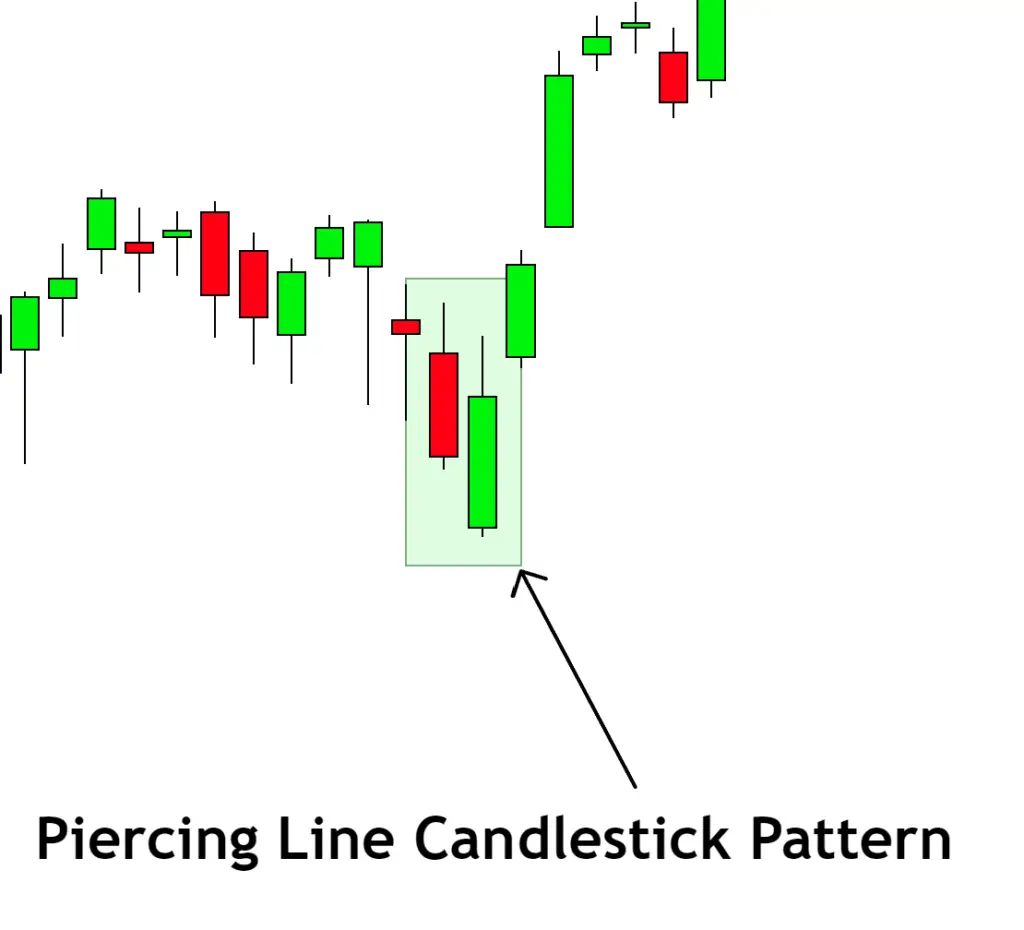
- Existing Downtrend: The pattern should appear in a pre-existing downtrend. This context is crucial as the Piercing Line is a bullish reversal pattern, indicating the potential shift from a bearish to a bullish market.
- Two-Candle Pattern: The Piercing Line consists of two candles. The first is a long bearish candle that continues the existing downtrend.
- Gap Down Opening: The second candle in the pattern should open below the close of the first candle, creating a gap down.
- Bullish Close: The second candle should be a long bullish one, closing above the midpoint of the first candle’s body, but not above its open.
- Color: The first candle is usually colored red (or black), indicating a bearish movement, while the second one is green (or white), indicating bullish movement.
By paying close attention to these details, traders can identify the Piercing Line pattern and make informed decisions based on its potential implications.
The Significance and Implications
The Piercing Line candlestick pattern holds great significance in technical analysis, mainly because it can indicate potential bullish reversals in the market.
- Reversal Indicator: Formed during a downtrend, the Piercing Line pattern suggests that the bears are losing control, and the bulls are ready to take the reins. When the second day opens with a gap down but then closes above the midpoint of the previous day’s body, it indicates a strong buying pressure.
- Confidence Booster: The pattern can bolster the confidence of the bulls in the market, potentially leading to an increase in buying activity and thus reinforcing the initial bullish signal.
- Forecasting Tool: If confirmed by other technical indicators, such as a surge in trading volume on the second day, the Piercing Line pattern can be a reliable tool to predict future bullish market movements.
Big Traders’ Activity During the Formation of a Piercing Line Pattern
The Piercing Line pattern’s formation is often associated with significant activity from big traders or institutional investors. Understanding these movements can provide valuable insights for retail traders.
- Shift in Control: The formation of a Piercing Line indicates a power shift from sellers to buyers. This could mean big traders are starting to accumulate positions, driving up the price.
- Gap Down Opening: The gap down opening on the second day might be a result of big traders initially pushing the price down, either to shake out weak holders or to accumulate more at lower prices.
- Volume Increase: A notable increase in volume on the second day indicates strong buying activity, likely driven by big traders taking advantage of the lower prices.
- Turnaround Point: If the pattern forms near key support levels or in oversold conditions, it can be an indication that big traders are stepping in to turn the market around.
Confirmation Tools
Here are four tools that can help confirm the validity and potential impact of a Piercing Line pattern:
- Key Support Levels: If the Piercing Line pattern forms near a key support level, it strengthens the case for a bullish reversal. Support levels are price levels at which buying pressure overcomes selling pressure, preventing the price from falling further.
- Volume Indicator: A significant increase in volume on the second day of the pattern (bullish candle day) confirms strong buying interest, lending credibility to the reversal signal.
- Oversold Conditions: If the pattern appears in oversold market conditions (e.g., indicated by oscillators like the Relative Strength Index (RSI) or Stochastic), it could increase the probability of a bullish reversal.
- Follow-up Bullish Candle: The appearance of another bullish candlestick after the Piercing Line pattern provides further confirmation of a potential bullish reversal.
Optimal Conditions
- Best Timeframe: The Piercing Line pattern can technically form on any timeframe. However, it’s generally more reliable on higher timeframes such as the daily and weekly charts because these capture more data, reducing noise and false signals.
- Trading Session: This pattern can appear in any trading session, including the U.S., European, or Asian sessions. However, the session’s volatility might affect the pattern’s reliability. For instance, during high volatility sessions, such as when the U.S. and European markets overlap, the pattern might hold more weight.
- Winning Ratio: The winning ratio for the Piercing Line pattern varies based on numerous factors, including the asset being traded and market conditions. However, studies suggest that it can have a success rate of approximately 65-70% when used in conjunction with other confirmatory indicators.
Trading Strategy with Confluence for Piercing Line Pattern
A well-devised trading strategy involves identifying high probability trade setups by adding confluence or multiple supporting factors. Here’s a simple strategy to trade the Piercing Line pattern:
- Entry Point: Wait for the Piercing Line pattern to form at a key support level or during oversold conditions. The completion of the pattern (closing of the second bullish candle) is the potential entry point for a long position.
- Stop Loss: The stop loss could be placed just below the low of the Piercing Line pattern. This ensures limited downside if the price moves against the expected direction.
- Take Profit Level: A preliminary profit target could be the next significant resistance level. However, based on the strength of the trend, traders may decide to adjust this target.
Conclusion
The Piercing Line pattern is a bullish reversal pattern that offers traders a signal to potentially enter a long position. When this pattern is accompanied by other supporting indicators and occurs at key price levels, it can provide more reliable signals. Like all trading strategies, this should be used in conjunction with sound risk management. Always remember that while patterns like the Piercing Line can provide clues about future price action, no pattern or strategy is foolproof.

