Definition:
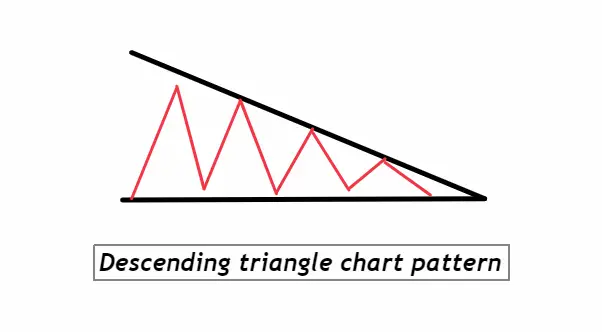
A descending triangle is a bearish chart pattern characterized by a flat support line and a downward-sloping resistance line converging towards a point. The descending triangle often signals potential downward momentum, commonly appearing during downtrends as a continuation pattern.
How to Identify a Descending Triangle Chart Pattern:
- Flat Support Line: Look for a horizontal line where the price seems to find support and bounces off repeatedly without breaking through to lower levels.
- Downward-Sloping Resistance Line: Spot a line that starts from a higher point and consistently forms lower highs, indicating selling pressure.
- Convergence: Ensure that the downward-sloping resistance line is moving towards the flat support line, eventually leading to a convergence or point where the two lines meet.
- Volume Profile: Ideally, there should be decreasing volume as the pattern progresses, with a spike in volume seen when the price eventually breaks out.
- Duration: A descending triangle can develop over various timeframes. However, for it to be significant, it should span multiple periods, whether they’re minutes, hours, days, or even weeks.
- Repetitive Tests: The more times the price tests the support or resistance without breaking it, the stronger the signal becomes once a breakout (typically downwards) occurs.
While the descending triangle is typically viewed as a bearish pattern, it’s crucial to wait for a confirmed breakout below the support level before taking a position, as patterns can occasionally defy expectations.
Significance of the Descending Triangle Chart Pattern:
1. Predictive Power: The descending triangle pattern is one of the most reliable and well-recognized technical patterns among traders. Its formation usually signals a continuation in a prevailing downtrend, giving traders an anticipatory edge. When price breaks out of this pattern, especially on increasing volume, it provides a strong confirmation of the predicted direction.
2. Risk Management: For traders, setting clear entry and exit points is vital, and the descending triangle provides just that. The flat support line serves as a clear level for setting stop-loss orders, ensuring that traders can cap potential losses if the pattern fails and the price unexpectedly reverses upwards. Conversely, a breakdown below the support can be used as an entry point for short positions or to exit long ones.
3. Clear Price Targets: A key benefit of the descending triangle is its ability to offer traders a projected price target. By measuring the height of the triangle at its widest point and then subtracting that from the breakout point at the support level, traders can estimate how far the price might decline post-breakout. This offers a quantifiable objective, assisting traders in profit-taking decisions.
4. Psychological Insight: The pattern provides insight into market psychology. The lower highs indicate decreasing demand and a growing bearish sentiment, while the consistent support level shows a temporary buying interest at that price. However, as sellers keep pushing the price down and buyers are unable to drive it higher, it signifies potential weakening of the buying side, often leading to a downward breakout.
In essence, the descending triangle serves as a valuable tool for traders, offering both a glimpse into market sentiment and practical strategies for trade execution. As with all technical patterns, it’s essential to use it in conjunction with other indicators and methods for the best results.
Activity of Big Traders During the Formation of a Descending Triangle:
1. Selling Pressure: The creation of lower highs, a defining feature of the descending triangle, often suggests that institutional investors or “big traders” are actively distributing or offloading their positions. Each time the price rises, it’s met with selling pressure at a progressively lower level, indicating that these big players are willing to sell at lower prices, hinting at a bearish outlook.
2. Defensive Buying: The horizontal support line, which remains consistent, implies that there’s a level where institutional buying occurs, but this buying is defensive in nature. It might be where they see value or have set predetermined accumulation levels. However, the fact that buyers don’t push the price to higher highs after each bounce indicates a lack of strong bullish conviction.
3. Breakout Watch: Institutional traders often wait for confirmations. When the price approaches the convergence point of the triangle, many big traders position themselves for the anticipated breakout. If the breakout is downward with significant volume, it’s a strong indication that big players have withdrawn their support and are potentially in active selling mode.
4. Volume Clues: One of the most telling signs of big trader activity is volume. A decline in volume as the triangle forms suggests reduced interest or a standoff between buyers and sellers. However, a sudden spike in volume, especially during a breakout, indicates active participation from big traders, either accelerating the sell-off or capitulating.
For retail traders, understanding these activities can be invaluable. It’s akin to “following the smart money.” When you discern that institutional traders are leaning bearish, aligning with them can often lead to better trading outcomes. However, always remember that the descending triangle, like any pattern, isn’t foolproof, and other market factors and news can influence its outcome. It’s essential to use it as one tool among many in a trader’s toolkit.
High Probability Confirmation Tools for the Descending Triangle Pattern
| Tool | Description |
|---|---|
| Key Support Level | A clearly defined horizontal support level that has been tested multiple times without being broken. This level acts as a strong barrier, and its eventual breach would signify a high-probability bearish move. |
| Break of Pattern Low | Once the pattern completes its formation, a break below the triangle’s lowest point (support level) can signal a strong continuation of the downtrend. |
| Volume Analysis | An increase in trading volume on the breakout is a strong confirmation. It suggests active participation and alignment from bigger players, making the breakout more credible. |
| Secondary Technical Indicators | Incorporating additional tools like the RSI (Relative Strength Index) or MACD (Moving Average Convergence Divergence) can help identify oversold conditions or momentum shifts, adding another layer of confirmation to the pattern’s forecast. |
By employing these confirmation tools, traders can increase their confidence in the descending triangle pattern and make more informed decisions on trade entries and exits.
Optimal Conditions for Trading the Descending Triangle Pattern
Best Timeframe: For more significant and reliable outcomes, the daily timeframe tends to offer the most robust results with the descending triangle pattern. While it can appear on shorter timeframes like the 1H or 4H charts, the daily chart often filters out market “noise” and better captures institutional trading behaviors.
Trading Session: The descending triangle can be traded in any session, but the major sessions – like the London or New York trading hours – provide higher liquidity and volume. This ensures smoother price action and more reliable breakouts, especially when large traders and institutions are most active.
Approximate Winning Ratio: The descending triangle, when traded with proper confirmation tools, can offer a winning ratio of around 60-65%. However, individual results may vary based on the trader’s skill, risk management, and the broader market context. It’s crucial always to pair pattern trading with rigorous stop-loss and take-profit strategies to maximize gains and limit losses.
Descending Triangle Trading Strategy with Confluence
1. Entry: When adding confluence, wait not only for the price to break below the support level but also for additional confirming signals. This could be a significant bearish candlestick pattern like a bearish engulfing or a crossover in the MACD. Enter the trade once these signals align and the price breaks and closes below the support level.
2. Stop-Loss: Place your stop-loss just above the last lower high within the triangle or slightly above the broken support level. The idea is that if the price reverses and moves back into the triangle, the breakout might be false, and it’s best to exit the trade to protect capital.
3. Take Profit: Measure the height of the triangle at its widest point. Project this distance downward from the breakout point to get a potential target. However, always monitor price action and adjust targets if necessary, especially when encountering significant support or resistance levels before reaching your calculated target.
Conclusion:
The descending triangle chart pattern provides traders with a potentially high-reward, low-risk trading opportunity. By adding elements of confluence, traders increase the probability of successful trades, ensuring that multiple technical indicators or price action signals align with the pattern’s breakout direction. As always, risk management is paramount, ensuring that the potential upside of trades significantly outweighs the downside.

