Definition:
The Rounded Top Pattern is a bearish reversal chart pattern indicating a gradual shift from buyers to sellers over a period of time. Often seen after an extended uptrend, the Rounded Top Pattern signals weakening bullish momentum and potential upcoming bearish trends.
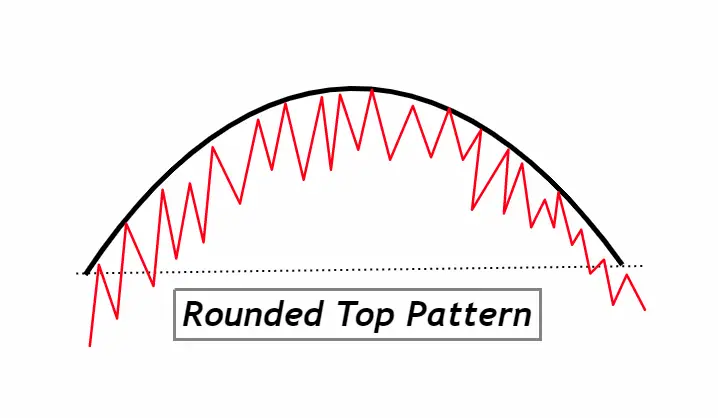
How to Identify the Rounded Top Pattern on a Chart:
- Prior Uptrend: Begin by looking for a preceding uptrend, which provides the context for the potential bearish reversal.
- Gradual Curvature: Unlike sharp peaks or spikes, the top should curve smoothly, resembling the top half of a circle or a rounded hill.
- Volume Pattern: Volume often diminishes as prices rise during the formation of the rounded top, indicating decreasing buyer interest. As the pattern completes and price starts to decline, volume tends to increase, suggesting a strengthening bearish momentum.
- Time Duration: The pattern typically takes longer to form than other top patterns, often spanning several weeks to several months.
- Support Break: For confirmation, watch for a break below the support level established at the beginning of the pattern’s formation. This often indicates the start of a new downtrend.
- No Sharp V-Reversals: The transition from the uptrend to the downtrend should be gradual. If there’s a sharp V-shaped reversal, it’s likely not a rounded top.
Remember, while the Rounded Top Pattern can be a powerful tool for predicting a bearish reversal, no pattern guarantees a specific market movement. Always use additional technical analysis tools and sound risk management practices when trading.
Significance of the Rounded Top Pattern:
- Shift in Market Sentiment: The Rounded Top Pattern is particularly significant because it illustrates a gradual, yet persistent, shift in market sentiment. Unlike abrupt patterns, the rounded top indicates that the bulls (buyers) are slowly losing their grip, and bears (sellers) are progressively taking control. This slow change can provide a more stable context for decision-making compared to sudden, volatile shifts.
- Predictive Power: Traders often rely on the Rounded Top Pattern to forecast potential bearish reversals. When confirmed, especially with a support break, this pattern can offer traders a timely opportunity to either exit long positions or consider taking short positions. The gradual nature of its formation provides traders with ample time to validate its development and prepare for a strategic trade entry or exit.
- Volume as Confirmation: One of the defining characteristics of this pattern is the relationship between its formation and volume. A decreasing volume during the pattern’s formation, followed by an increasing volume as prices begin to decline, reinforces its bearish implication. This volume trend acts as an additional layer of validation for traders, enhancing the pattern’s reliability.
In summary, the Rounded Top Pattern serves as a beacon for traders, alerting them to a potential change in the market’s direction. Its methodical formation offers traders a more predictable and less chaotic environment, making it a favored pattern among many professionals. Understanding and recognizing this pattern can be a valuable asset in a trader’s toolkit, especially when combined with other technical analysis tools.
Activity of Big Traders During the Formation of the Rounded Top Pattern:
- Distribution Phase: Often, the formation of a Rounded Top Pattern can be synonymous with what is known as the “distribution phase.” In this stage, institutional investors or “smart money” gradually distribute or sell their positions. This distribution is typically executed discreetly to avoid triggering a sudden market drop. The rounded top, with its gradual price decline, is reflective of this calculated, methodical offloading of positions.
- Decreasing Buy Orders: As the pattern progresses, the diminishing volume often indicates reduced buying interest from these large traders. They might either be holding off on new buy orders or are quietly selling their positions, leading to the lackluster performance of the asset.
- Hedging and Derivative Strategies: Big traders might not just sell their positions in the underlying asset. They may employ derivative strategies, like buying put options, to hedge their positions or profit from a potential decline. This activity might not immediately reflect in the asset’s price, but can be seen in increased volume or volatility in the options or futures markets.
- Tactical Short Positions: Once the pattern nears completion, especially after the break of support, institutional traders may initiate short positions, expecting the asset to decline further. This action can accelerate the bearish momentum, as increased selling pressure compounds with the existing bearish sentiment.
Understanding the maneuvers of institutional or big traders during the formation of the Rounded Top Pattern is crucial. For retail traders, being attuned to these activities can provide deeper insights into potential market moves. While the chart reflects price and volume, the nuances behind these movements, often driven by large traders, are what can truly guide a retail trader’s decision-making process. It’s always a game of deciphering not just what the chart shows, but also understanding the hidden chess moves being played in the background.
Confirmation Tools for the Rounded Top Pattern:
| Tool | Description |
|---|---|
| Key Support Levels | Monitor established support levels. A break below these levels after the formation of the rounded top provides strong confirmation of a potential sustained bearish move. |
| Break of Initial Low | After the pattern forms, a break below the initial low of the pattern is a potent signal of continued downward momentum and can be used as an entry point for short positions. |
| Volume Analysis | A decline in volume during the pattern’s formation followed by a surge in volume as prices start to decline reinforces the bearish implication, confirming the pattern’s validity. |
| Technical Indicators | Utilizing indicators like the Moving Average Convergence Divergence (MACD) or Relative Strength Index (RSI) can provide additional confirmation. A bearish MACD crossover or an RSI moving below 50, for example, can further support the bearish outlook initiated by the rounded top. |
Employing these tools in conjunction with the Rounded Top Pattern will heighten the trader’s confidence in their analysis, increasing the probability of successful trade outcomes.
Trading the Rounded Top Pattern: Key Considerations
- Best Timeframe: For the Rounded Top Pattern, the daily and weekly timeframes tend to be the most reliable. These longer timeframes capture the gradual nature of the pattern and reduce the noise found in shorter periods.
- Trading Session: While the pattern can form in any trading session, it’s most influential when identified during the major market sessions, such as the New York or London sessions, due to the higher liquidity and volume during these periods.
- Winning Ratio: Historically, the Rounded Top Pattern has a winning ratio ranging from 60-70% when confirmed with the aforementioned tools. However, always bear in mind that past performance does not guarantee future results, and it’s essential to employ proper risk management techniques.
These considerations, when combined with a thorough analysis and sound trading strategies, can help traders capitalize on the opportunities presented by the Rounded Top Pattern.
Trading Strategy with Confluence for the Rounded Top Pattern:
- Confluence Factors: Before trading the Rounded Top Pattern, seek additional confirmation signals to enhance the reliability of the pattern. These can include:
- Technical indicators showing bearish signals (e.g., bearish MACD crossover, RSI below 50).
- Major support and resistance levels.
- Fibonacci retracement levels aligning with the pattern’s structure.
- Entry Point: Enter a short position once the price breaks below the initial low of the pattern, especially if this break is supported by high volume. If additional confluence factors are present and validate the bearish move, this can bolster the entry signal.
- Stop Loss: Set a stop loss slightly above the highest point of the Rounded Top. This ensures that if the pattern proves to be invalid and the price starts a bullish move, your loss is minimized.
- Take Profit Level: Target a take profit level at a distance equivalent to the height of the pattern, projected downward from the point of the breakout. Alternatively, you can use major support levels or Fibonacci extension levels as potential profit targets.
Conclusion:
The Rounded Top Pattern offers traders a valuable insight into potential bearish reversals in the market. By integrating confluence factors into the trading strategy, the reliability of trading signals derived from this pattern can be enhanced. As with all trading strategies, it’s crucial to employ risk management practices, ensuring that potential rewards justify the risks taken. This chart pattern, when understood and applied judiciously, can be a powerful tool in a trader’s arsenal.

