Welcome to the world of forex trading, where the Moving Average Convergence Divergence (MACD) indicator stands as a pivotal tool for traders. This powerful indicator helps reveal market trends and potential turning points in currency pairs. Whether you’re a seasoned trader or just starting, understanding MACD can significantly enhance your trading strategy. Let’s dive into the essentials of MACD and uncover how it can become your ally in navigating the forex markets.
What is MACD?
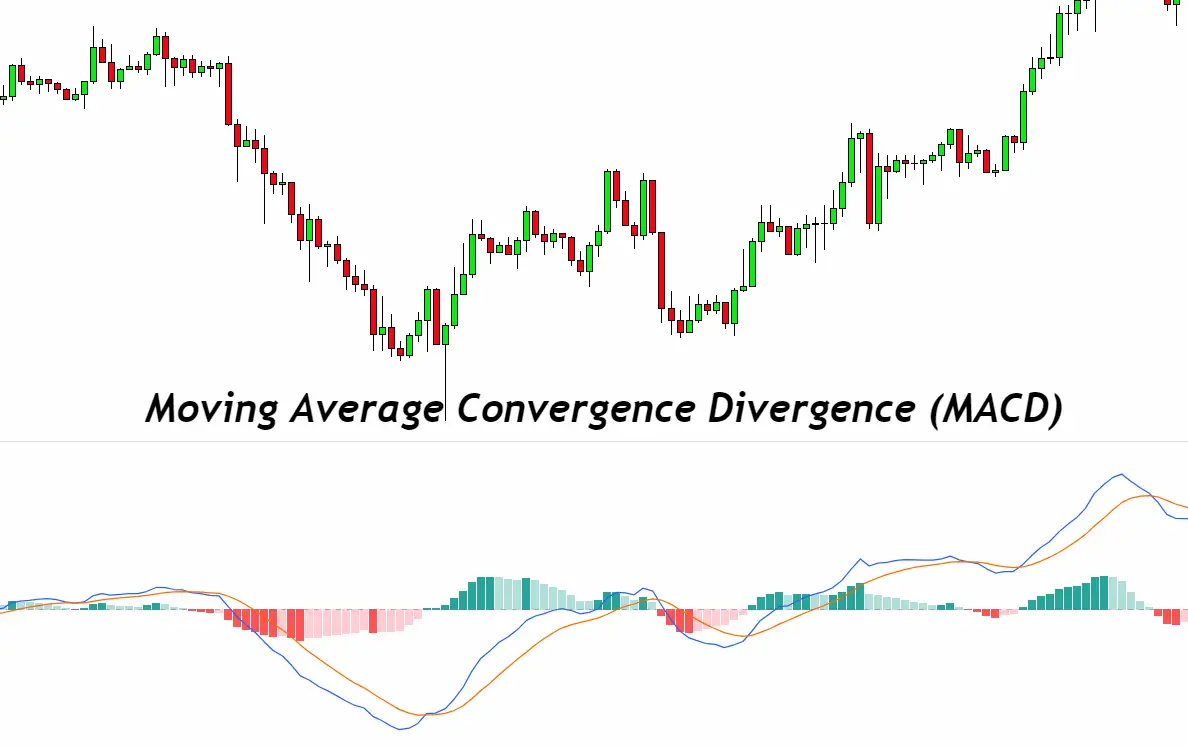
The Moving Average Convergence Divergence (MACD) is a dynamic indicator in the forex trading world. It measures the momentum of price movements and identifies trend directions over time. At its core, MACD uses a pair of moving averages and analyzes the difference between them. The indicator consists of three main components:
- MACD Line: The difference between the 26-period Exponential Moving Average (EMA) and the 12-period EMA.
- Signal Line: The 9-period EMA of the MACD Line.
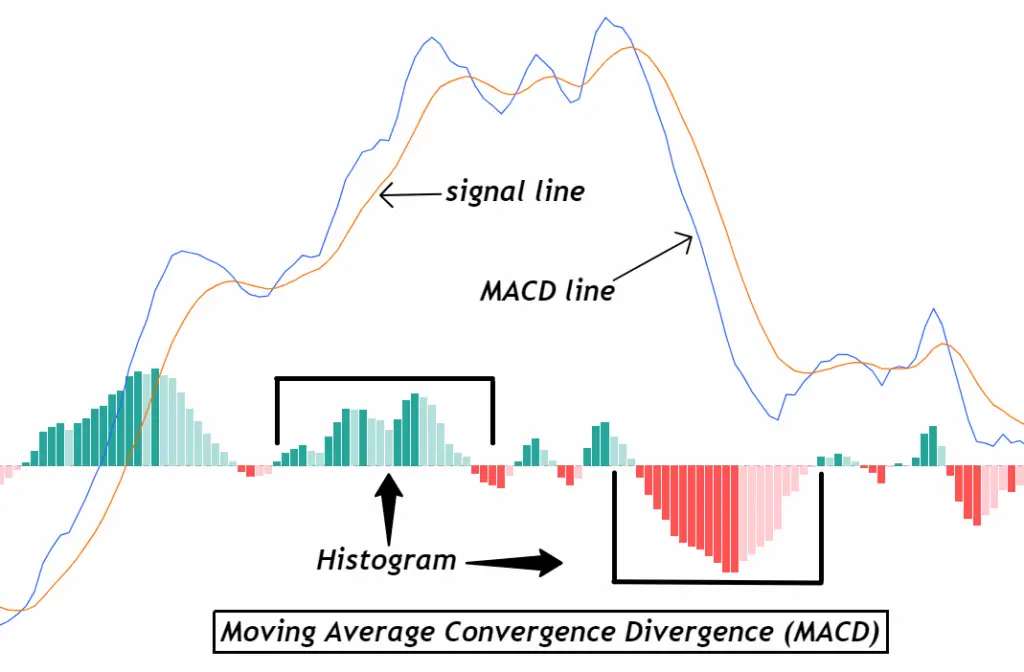
- Histogram: The graphical representation of the difference between the MACD Line and the Signal Line.
Traders rely on MACD for signals on when to buy or sell currency pairs, making it an essential tool for strategic decision-making in forex trading.
How MACD Works
Understanding how the Moving Average Convergence Divergence (MACD) works is key to leveraging its full potential in forex trading. Here’s a breakdown of its functionality:
- Calculation: The MACD indicator starts with the difference between two Exponential Moving Averages (EMAs) – typically the 12-period EMA and the 26-period EMA. This difference forms the MACD line.
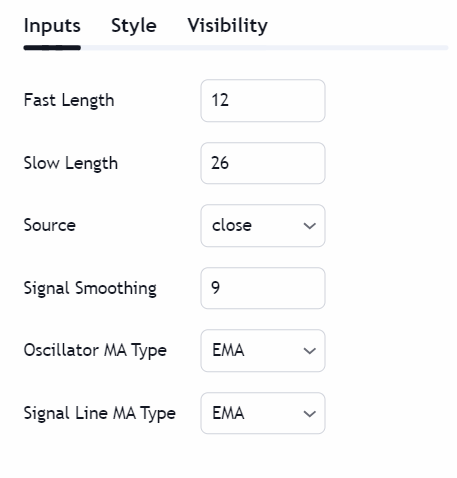
- Signal Line: The second step involves smoothing the MACD line by calculating its 9-period EMA, known as the Signal Line. This line signals potential buy or sell opportunities based on its crossover with the MACD line.
- Crossovers: When the MACD line crosses above the Signal Line, it suggests an upward momentum, hinting at a potential buy signal. Conversely, when the MACD line crosses below the Signal Line, it indicates downward momentum, signaling a potential sell.
- Histogram: The MACD Histogram provides a visual representation of the distance between the MACD line and the Signal Line. It helps traders identify the strength and momentum of a trend.
By closely monitoring these components, traders can make informed decisions, catching trends early and potentially increasing their chances of successful trades.
Benefits of Using MACD
The Moving Average Convergence Divergence (MACD) offers several advantages for forex traders, making it a popular choice in trading strategies. Here are some of the key benefits:
- Trend Identification: MACD excels at identifying both the direction and the strength of market trends. This allows traders to align their strategies with the overall market momentum.
- Signal Clarity: The clear buy and sell signals generated by MACD line crossovers with the signal line simplify decision-making, especially for new traders.
- Versatility: MACD is adaptable to various trading timeframes, from short-term scalping to long-term positional trading, making it suitable for different trading styles.
- Divergence Detection: MACD can reveal divergences between price movements and momentum, often signaling potential trend reversals or continuations.
- Confirmation Tool: When used in conjunction with other indicators and analysis methods, MACD can serve as a powerful confirmation tool, increasing the reliability of trading signals.
These benefits make MACD an invaluable tool in the arsenal of forex traders, providing insights that can lead to more informed and potentially profitable trading decisions.
How to Interpret MACD Signals
Interpreting signals from the Moving Average Convergence Divergence (MACD) is crucial for making informed trading decisions. Here’s how to read MACD signals effectively:
- MACD Line Crossovers: The most basic MACD signal is the crossover. When the MACD line crosses above the signal line, it indicates bullish momentum, suggesting a potential buying opportunity. Conversely, a crossover below the signal line indicates bearish momentum, hinting at a selling opportunity.
- Centerline Crossovers: The MACD line’s movement relative to the zero line (centerline) also provides insight. Moving above the zero line signals upward momentum (bullish), while dropping below it indicates downward momentum (bearish).
- Divergence: Pay attention to divergence between the MACD and price action. If the price hits new highs or lows but the MACD does not, it may signal an impending reversal. Bullish divergence occurs when the price forms lower lows while the MACD forms higher lows, suggesting an upward trend. Bearish divergence happens when the price creates higher highs while the MACD sets lower highs, indicating potential downward movement.
- Histogram: The MACD histogram offers a visual representation of the momentum. Widening bars suggest increasing momentum, while narrowing bars indicate decreasing momentum. A flip from negative to positive or vice versa can signal a change in trend direction.
By mastering these signals, traders can better navigate the forex market, spotting opportunities for entry and exit more effectively.
MACD Trading Strategies
Leveraging the Moving Average Convergence Divergence (MACD) effectively can greatly enhance your trading strategy. Here are some proven MACD trading strategies to consider:
- Trend Following: One of the most straightforward strategies involves acting on MACD line crossovers with the signal line. Buy when the MACD line crosses above the signal line (bullish signal) and sell when it crosses below (bearish signal).
- Divergence Trading: Keep an eye out for divergence between the MACD and the price action. A bullish divergence, where the price records lower lows but the MACD forms higher lows, can indicate a potential upward trend reversal. Similarly, a bearish divergence, with the price making higher highs but the MACD showing lower highs, may signal a downward trend reversal.
- Zero Line Crossover: This strategy focuses on when the MACD line crosses the zero line. A cross above the zero line indicates bullish momentum, suggesting a buying opportunity, while a cross below signals bearish momentum, potentially a good time to sell.
- Combining MACD with Other Indicators: For added confirmation, use MACD in conjunction with other technical indicators, such as the Relative Strength Index (RSI) or moving averages. This multi-indicator approach can help validate the signals provided by the MACD.
Implementing these strategies can help traders identify potential entry and exit points, manage risk, and capitalize on market trends more effectively.
Tips for Maximizing the Effectiveness of MACD
To enhance your trading results with the Moving Average Convergence Divergence (MACD), consider these practical tips:
- Use in Trending Markets: MACD tends to perform best in trending markets. Identify the overall trend before applying MACD signals to ensure alignment with market momentum.
- Combine with Other Indicators: Pair MACD with other indicators like RSI, Bollinger Bands, or moving averages for more robust signals. This reduces the risk of false signals.
- Apply Multiple Timeframes: Analyze MACD signals across different timeframes for a comprehensive view. Confirm signals on a longer timeframe before entering trades on a shorter one.
- Be Mindful of Market Conditions: MACD may generate false signals in volatile or ranging markets. Adjust your strategy or use additional analysis methods in such conditions.
- Practice Patience: Wait for MACD lines to clearly cross and confirm the trend direction before making a trade. Premature entries can lead to losses.
- Set Stop Losses: To manage risk effectively, always set stop losses based on your risk tolerance and trading strategy.
- Keep a Trading Journal: Document your trades and the corresponding MACD signals. Reviewing your history can help refine your strategy and improve future decision-making.
Implementing these tips can increase the effectiveness of MACD in your forex trading strategy, leading to more informed and potentially profitable trading decisions.
Common Mistakes to Avoid
When using the Moving Average Convergence Divergence (MACD) indicator, traders often fall into certain traps. Being aware of these common mistakes can help enhance your trading strategy:
- Overreliance on MACD: Don’t use MACD in isolation. Combine it with other analysis tools and market context to make informed decisions.
- Ignoring Market Context: Always consider the overall market environment. MACD signals might be less reliable in choppy or range-bound markets.
- Misinterpreting Divergence: Divergence can be a powerful signal but ensure it’s significant and confirmed by other indicators or price action.
- Chasing Signals: Avoid making hasty trades based on MACD crossovers alone. Wait for additional confirmation to reduce the risk of false signals.
- Neglecting Stop Losses: Always set stop losses to manage risk, even when signals appear strong.
- Overtrading: Don’t trade every MACD signal. Be selective and focus on those with the strongest confluence with other indicators and market factors.
Avoiding these mistakes can lead to more disciplined and successful trading using the MACD indicator.
Conclusion
The Moving Average Convergence Divergence (MACD) is a versatile and powerful tool in forex trading, offering insights into market momentum and trend direction. By understanding how to interpret its signals, including line crossovers, divergences, and the histogram, traders can make more informed decisions. However, it’s crucial to use MACD as part of a comprehensive trading strategy, combining it with other indicators and market analysis to confirm signals and manage risk effectively. Avoid common pitfalls such as overreliance on MACD or ignoring market context to enhance your trading effectiveness. With practice and a disciplined approach, MACD can become a valuable component of your trading arsenal, helping you to identify potential opportunities in the forex market.

