Definition:
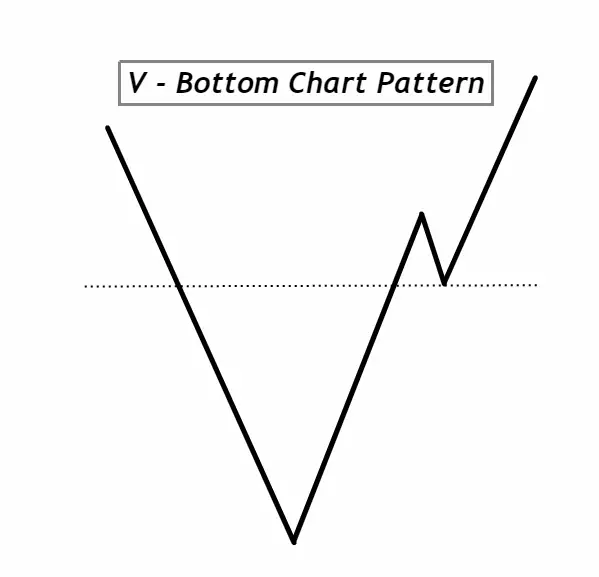
A V-bottom chart pattern is a sharp reversal pattern characterized by a significant sell-off followed immediately by a strong rally, resembling the letter “V” on the price chart. Often seen after prolonged downtrends, the V-bottom signals a swift change in sentiment, indicating that the selling pressure has been exhausted and buyers have regained control.
How to Identify a V-bottom Chart Pattern:
- Prolonged Downtrend: Look for an existing and significant downtrend. This sets the stage for a potential V-bottom formation.
- Sharp Decline: The left side of the “V” is characterized by a sudden and intense sell-off, usually on high volume, indicating strong selling pressure.
- No Consolidation: Unlike other reversal patterns that might have some consolidation or a rounded base, the V-bottom has a very sharp reversal point, making the pattern resemble the letter “V.”
- Swift Reversal: The right side of the “V” showcases a strong rally, almost mirroring the initial decline. This rally should be as intense and sharp as the sell-off, indicating a strong shift in sentiment.
- Volume Confirmation: Ideally, the reversal upwards should be supported by increasing volume, suggesting that buyers are stepping in with conviction.
- Resistance Level: Post-reversal, observe if the price breaks above previous resistance levels. A breakout can be an added confirmation of the pattern’s validity.
- Duration: The entire formation of a V-bottom, from the start of the decline to the full recovery, is usually swift. It can occur over days to a few weeks, but rarely over extended periods.
Significance of the V-bottom Chart Pattern:
- Sentiment Shift Indicator: The V-bottom is a vivid representation of a sudden and decisive change in market sentiment. The sharp decline indicates a climax of selling pressure, often driven by panic or capitulation. When this selling exhausts itself and is immediately followed by a robust rally, it’s a clear sign that buyers have re-entered the market with force. This abrupt shift can be a strong indication that the prevailing downtrend has come to an end.
- High Conviction Reversal: Unlike some other reversal patterns that may show hesitation or a period of consolidation, the V-bottom’s stark and symmetrical nature underscores its significance. The lack of consolidation suggests that the market has made a clear decision to change direction, giving traders a level of confidence in the pattern’s reliability.
- Potential Entry & Exit Points: For traders, the V-bottom can offer strategic entry and exit points. The beginning of the sharp rally (the bottom of the “V”) can be an optimal entry point for long positions, especially when supported by high volume. Conversely, for those who were short during the downtrend, recognizing the formation early can signal an opportune moment to exit and lock in profits.
- Complementary to Other Tools: While the V-bottom is a strong pattern on its own, its potency is amplified when used in conjunction with other technical indicators, such as RSI, MACD, or volume analysis. When multiple tools align in their signals, traders can make more informed decisions with increased confidence in the market’s direction.
In summary, the V-bottom chart pattern serves as a high-conviction visual cue of a market turnaround. Its clear, decisive structure aids traders in identifying pivotal moments in the market, making it a valuable tool in a trader’s arsenal.
Activity of Big Traders During the Formation of a V-bottom Pattern:
- Capitulation and Liquidation: As the V-bottom begins its sharp decline, it’s often driven by a culmination of selling pressure. This is not just retail traders panicking; it can also be big institutional players offloading positions, either to mitigate risks or in response to systematic strategies. Such aggressive selling amplifies the downtrend, causing prices to drop steeply.
- Smart Money Accumulation: Near the bottom of the “V”, discerning institutional traders, often referred to as the “smart money,” recognize the excessive pessimism. They see the market’s oversold condition as a buying opportunity and begin to accumulate positions. Their high-volume buying can initiate the swift reversal that characterizes the V-bottom.
- Momentum & Follow-Through: Once the reversal begins, other large players and algorithmic trading systems may recognize the change in sentiment and start buying into the rally. This can be due to various reasons – covering short positions, momentum strategies, or simply reacting to the clear shift in market dynamics. The confluence of these buying activities further fuels the ascent, making the rally as pronounced as the initial decline.
- Confirmation and Continuation: As the pattern completes and the price begins to challenge previous resistance levels, other institutional players might seek confirmation before committing. If the break above resistance comes with high volume and other positive technical indicators, it can be seen as a validation of the pattern, leading to further participation from big traders and a potential continuation of the bullish trend.
For retail traders, understanding these behind-the-scenes dynamics is crucial. Recognizing that a V-bottom is not just a simple price pattern, but a reflection of the collective actions of major market participants, can provide deeper insights into the market’s direction. It underscores the importance of volume analysis alongside the pattern, as volume can offer clues about the involvement of institutional traders. When retail traders can align their strategies with these big players, it often increases the odds of successful trades.
Confirmation Tools for the V-bottom Chart Pattern
| Tool | Description |
|---|---|
| Key Resistance Levels | Look for a break above significant resistance levels post the formation. A clean break indicates strong buying interest and adds credibility to the pattern. |
| Break of Previous Low | After the pattern forms, if prices don’t retest or break below the V’s bottom, it suggests the reversal is genuine and the bearish sentiment has been exhausted. |
| Volume Analysis | High volume during both the decline and the rally is crucial. An increase in volume on the rally side indicates strong buying conviction, confirming the pattern’s authenticity. |
| Technical Indicators | Using tools like the Relative Strength Index (RSI) or Moving Average Convergence Divergence (MACD) can provide added confirmation. For instance, bullish divergence on the RSI or a bullish MACD crossover can signal strengthening momentum. |
Using these tools in tandem with the V-bottom chart pattern can significantly enhance a trader’s ability to gauge its reliability and act accordingly.
Trading the V-bottom Chart Pattern: Key Insights
Best Timeframe:
For optimal clarity and reliability, the daily timeframe (D1) often provides the most definitive V-bottom formations. This timeframe filters out intraday noise and captures the broader market sentiment.
Trading Session:
The V-bottom can form in any trading session, but it’s essential to consider major market opens (like London or New York) where volume and volatility surge, potentially accentuating the pattern’s formation.
Winning Ratio:
While the V-bottom is a robust pattern, no single pattern guarantees success. In a well-structured trading plan, the V-bottom might offer a winning ratio of approximately 60-70%, especially when used with complementary confirmation tools. However, always manage risk appropriately, as market conditions can vary.
V-bottom Chart Pattern Trading Strategy with Confluence
Entry:
Enter a long position when the price starts its upward movement from the bottom of the “V”. For added confluence, ensure this movement is accompanied by a breakout above a key resistance level or a significant moving average.
Stop-Loss:
Place your stop-loss just below the lowest point of the V-bottom. This ensures that if the pattern fails and the price drops back, you limit potential losses. For added protection, consider a buffer of a few pips or a percentage below the V-bottom, depending on the asset’s volatility.
Take Profit Level:
Set your initial take profit at the next significant resistance level post the V-bottom formation. If the asset has a history of moving in ranges, consider setting the take profit at the range’s upper boundary. For a more dynamic approach, you can trail your stop as the price moves upward, locking in profits along the way.
Confluence Factors:
Enhance the strategy’s reliability by adding confluence:
- Volume Analysis: A surge in buying volume during the upward movement adds credibility to the bullish reversal.
- Technical Indicators: Bullish signals from indicators like RSI (potentially moving above 30 from oversold regions) or a bullish MACD crossover can further confirm the pattern’s strength.
- Price Action: Candlestick patterns, such as bullish engulfing or hammer candles at the V-bottom, can indicate strong buying interest.
Conclusion:
The V-bottom chart pattern, when identified correctly, offers traders a clear visual representation of a sharp market reversal. By adding confluence through various technical tools and price action, traders can enhance the pattern’s reliability and increase the probability of successful trades. Always remember, no single pattern or strategy is foolproof. Risk management and continuous learning are key components of sustainable trading success.

