Definition
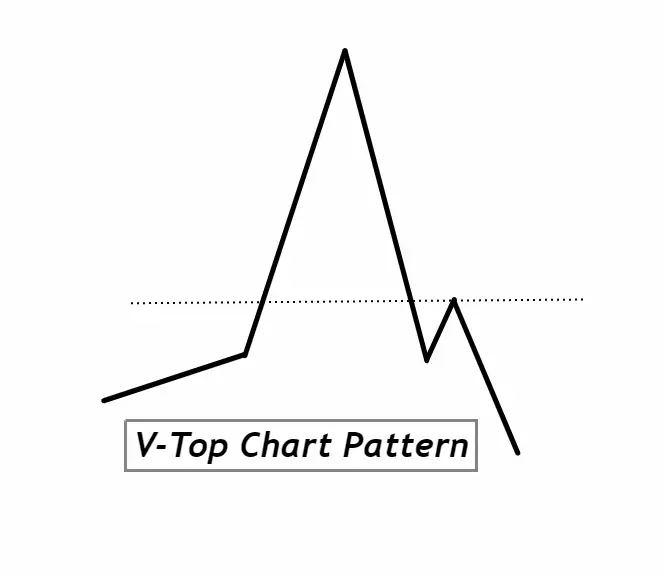
The V-Top Chart Pattern signifies a sharp reversal in an uptrend, resembling the letter “V” where price rises steeply and then abruptly declines. A V-Top indicates a sudden shift in sentiment, with buyers losing momentum and sellers taking control, often leading to a potential trend change.
How to Identify the V-Top Chart Pattern:
- Uptrend Precedence: Before the formation of a V-Top, there should be a clear and established uptrend.
- Sharp Price Increase: Look for a rapid and almost vertical price ascent. This represents strong buying activity.
- Peak Formation: The top of the ‘V’ is where the price reaches its highest point. It might show signs of struggle, like small wicks, indicating a potential reversal.
- Abrupt Reversal: Immediately after reaching the peak, there should be a sharp and rapid decline in price, resembling the initial ascent but in the opposite direction.
- Volume Confirmation: Often, the volume will increase during the rapid ascent and then again during the sharp decline, signaling strong participation during both phases.
- Duration: V-Tops are typically short-term patterns. Their formation is quick, representing a sudden shift in market sentiment.
- Failed Breakouts: At times, before reversing, there may be a false breakout at the top where the price tries to push higher but fails, adding to the reversal’s validity.
Significance of the V-Top Chart Pattern:
1. Momentum Shift Indicator: The V-Top pattern is highly regarded for its ability to highlight a sudden and pronounced shift in momentum. In an environment where traders are constantly seeking early signals of potential trend reversals, the V-Top stands out as a beacon. When spotted, this pattern can alert traders to a rapid change in sentiment from bullish to bearish, giving them an edge in anticipating potential downtrends.
2. Entry and Exit Points: For traders, one of the primary challenges is determining optimal entry and exit points. A V-Top, with its sharp ascent followed by an equally sharp descent, provides clear demarcations. The initial climb signals a continuation of the bull run – a potential entry point for those who believe the trend will persist. Conversely, the abrupt reversal offers a strategic exit point for those looking to protect gains or even initiate a short position.
3. High Conviction Signal: While many chart patterns can be ambiguous or open to interpretation, the V-Top’s distinct and symmetrical shape offers traders a high conviction signal. Its presence suggests a strong consensus among market participants: an enthusiastic buy-in followed by an almost immediate unanimous exit. This level of consensus can bolster a trader’s confidence in the pattern’s predictive power.
4. Risk Management: For new traders, especially, managing risk is paramount. The V-Top serves as a crucial warning sign. When identified, it can prompt traders to tighten stop-loss orders or reconsider long positions, thus helping in effectively managing potential losses in a volatile market scenario.
Activity of Big Traders During V-Top Formation:
1. Accumulation and Distribution: As the price starts its sharp ascent, forming the initial leg of the V-Top, it’s often fueled by institutional or big traders accumulating positions. They capitalize on the prevailing bullish sentiment, driving prices higher. However, the peak of the V-Top often signifies a phase where these big players begin distributing or offloading their positions. This distribution is executed swiftly, causing the rapid price decline that characterizes the V-Top pattern.
2. Market Manipulation: At times, the rapid ascent can be a result of deliberate price pushing by institutional traders, creating an illusion of continued bullish momentum. Retail traders, lured by this momentum, jump in to buy, further inflating the price. Once the desired price level is reached, these big traders start selling off their positions en masse, leading to the sharp downturn. This maneuvering allows big traders to exit at peak prices while leaving less-informed retail traders holding positions that quickly depreciate.
3. Liquidity Harvesting: The sharp ascent draws attention, and as more retail traders join the rally, liquidity in the market increases. Institutional traders need this liquidity to offload their sizable positions without causing a massive price drop prematurely. Thus, the V-Top’s peak often represents a point of maximum liquidity, where big traders can execute large orders with minimal slippage.
4. Psychological Play: The abruptness of the V-Top’s decline, following its sharp ascent, instills fear and panic in the market. Retail traders, caught off-guard, may sell-off in a frenzy, further exacerbating the decline. Big traders, having anticipated and often engineered this shift in sentiment, can exploit the situation either by exiting their positions at favorable prices or by shorting the market to capitalize on the subsequent downtrend.
For retail traders, understanding these underlying dynamics is crucial. It’s a reminder that charts often reflect the collective actions of both institutional and retail participants, and by discerning the strategies of big players, retail traders can navigate the markets more effectively.
V-Top Chart Pattern Confirmation Table
| Tool/Indicator | Confirmation Criteria |
|---|---|
| Key Level (Support/Resistance) | If the V-Top forms around a historical resistance level, it strengthens the reversal signal. Conversely, if the subsequent drop approaches a known support level and breaks through it, the bearish sentiment is confirmed. |
| Break of Low After Formation | A conclusive break below the low point (or base) formed between the two legs of the V-Top serves as a strong confirmation of the pattern. If prices move decisively below this level, it indicates sustained bearish momentum. |
| Volume Analysis | A surge in volume during the pattern’s ascent followed by another high volume spike during the decline reinforces the pattern’s validity. High volume during the decline especially indicates a strong sell-off, confirming the bearish reversal. |
| Technical Oscillators | Oscillators like the RSI (Relative Strength Index) can provide added confirmation. If RSI shows overbought conditions as the V-Top peaks and then rapidly moves towards or into oversold territory during the decline, it bolsters the bearish reversal signal. |
By utilizing these tools in conjunction, traders can achieve a higher probability confirmation of the V-Top pattern, leading to more informed trading decisions.
Optimal Trading Parameters for V-Top Pattern:
Best Timeframe: For the V-Top pattern, the daily timeframe offers a balanced view of market structure and sentiment shifts, making it ideal for spotting this formation and its potential implications.
Trading Session: While the V-Top can form in any session, its significance is accentuated during major trading sessions like the London or New York sessions, where liquidity and participation are at their peak.
Winning Ratio: Based on historical analysis and given proper confirmation tools, the V-Top pattern can offer a winning ratio of approximately 60-70%. It’s essential to employ strict risk management strategies to optimize returns within this range.
V-Top Trading Strategy with Confluence:
1. Entry Point: Wait for the V-Top pattern to complete. Upon confirmation (using tools like key levels, volume, and oscillators), enter a short position when the price breaks below the low point (or base) formed between the two legs of the V-Top.
2. Stop-Loss: Place the stop-loss slightly above the peak of the V-Top. This ensures minimal losses if the price unexpectedly surges upwards and the pattern fails.
3. Take Profit: For a conservative approach, set the take profit level at a known support level or a Fibonacci retracement level (like the 61.8% mark) below the V-Top base. For a more aggressive approach, aim for an extended target such as the next major support level or a full 100% retracement of the preceding bullish move.
Confluence Factors to Enhance Strategy:
- Trendline Breaks: If the decline post V-Top also breaks a long-standing trendline, it adds weight to the bearish bias.
- Moving Averages: A crossover of short-term moving averages below longer-term ones after the pattern formation can serve as an added confirmation.
- Bearish Candlestick Patterns: If the peak or the reversal point of the V-Top is accompanied by bearish candlestick patterns (like a shooting star or bearish engulfing), it strengthens the reversal signal.
Conclusion:
The V-Top chart pattern, symbolizing a sharp trend reversal, is a powerful tool in a trader’s arsenal when confirmed with confluence factors. Its distinct shape offers clear entry and exit parameters, making it especially valuable for traders aiming for high-probability setups. However, like all trading strategies, discipline in risk management and continuous evaluation is essential to achieve consistent success.

