Definition:
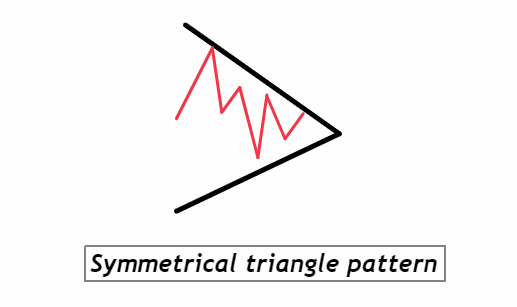
The symmetrical triangle pattern is a consolidation chart pattern characterized by converging trendlines connecting lower highs and higher lows. As a reflection of indecision in the market, the symmetrical triangle offers traders insights into potential breakout directions, signaling either a continuation or reversal of the prevailing trend.
Identifying the Symmetrical Triangle Pattern on the Chart
- Converging Trendlines: Look for a series of lower highs and higher lows on the chart. These should be connected by two trendlines that converge as they extend, forming the triangle shape.
- Duration: The pattern typically develops over a period that can range from a few weeks to several months. The closer the price gets to the apex (where the trendlines converge), the closer it is to a potential breakout.
- Volume Decline: As the triangle forms, trading volume usually diminishes, indicating a decreasing momentum and a period of market consolidation.
- Flat or Horizontal Base: In some cases, the lower trendline (support) can be more horizontal, while the upper trendline (resistance) continues to slope downward.
- Breakout Point: The pattern is confirmed when the price breaks out of the triangle, either upwards or downwards. This breakout often occurs 2/3 to 3/4 of the way through the pattern, before the trendlines converge.
- Volume Surge on Breakout: A significant increase in volume as the price breaks out of the triangle adds validity to the breakout, signaling stronger conviction from traders.
By spotting these characteristics in sequence, traders can effectively identify the symmetrical triangle pattern on a chart and anticipate potential price movements.
Significance and Indications of the Symmetrical Triangle Pattern
- Market Indecision: The symmetrical triangle underscores a period of equilibrium, where neither the bulls nor the bears have definitive control. This consolidation is marked by shrinking volatility as represented by the converging trendlines. For traders, recognizing this pattern alerts them to an imminent explosive move once the market decides its direction.
- Predictive Qualities: Though the symmetrical triangle can break out in either direction, its prior trend can offer clues. If formed during an uptrend, it might indicate a continuation, while in a downtrend, it could suggest a reversal. However, it’s paramount to wait for a clear breakout to validate these anticipations.
- Clear Risk Management: The defined borders of the triangle provide traders with actionable levels for trade management. The opposing trendline from the breakout can act as a stop-loss point, ensuring traders have a clear exit strategy if the pattern fails.
- Volume as a Confirmation: The interplay of volume within the symmetrical triangle is crucial. A declining volume during its formation followed by a surge on breakout adds a layer of confirmation. This volume analysis helps traders gauge the conviction behind the breakout, offering a higher probability of success.
In essence, the symmetrical triangle serves as both a warning and an opportunity. While it indicates a market on the cusp of a decision, it also offers traders the tools to capitalize on the eventual breakout, backed by volume dynamics and clear structural boundaries.
Behind the Scenes: Big Traders and the Symmetrical Triangle
Understanding the moves of institutional or “big” traders during the formation of a symmetrical triangle can give retail traders an edge in their decision-making processes.
- Positional Adjustments: As the symmetrical triangle begins to shape, big traders are often in a phase of adjusting their positions. They might be taking profits from earlier trades or recalibrating their portfolios, leading to the decreasing volatility and volume seen within the triangle.
- Gathering Consensus: The formation of the symmetrical triangle is often a period where large institutions are evaluating the market, gathering data, and reaching a consensus on the future direction of the asset. This can be seen as a tug-of-war between bulls and bears, with neither gaining a decisive advantage.
- Order Clusters: Close to the apex of the triangle, institutional traders place clusters of orders just outside the converging trendlines. These orders, once triggered, can lead to explosive moves, as they compound the breakout’s force. This activity explains the swift and decisive price action observed when the triangle’s boundaries are breached.
- Volume Surge Post-Breakout: The breakout’s surge in volume is often a combination of retail traders jumping onto the breakout and big traders reinforcing their positions, solidifying the new direction of the trend.
In sum, the symmetrical triangle’s development can be viewed as a strategic pause in the market, with big traders gauging, planning, and eventually committing to a direction. Recognizing this interplay allows retail traders to position themselves in tandem with these market movers, ensuring they ride the wave rather than being caught in its wake.
Confirmation Tools for the Symmetrical Triangle Pattern
| Tool | Description |
|---|---|
| Breakout Level Confirmation | Monitor for a decisive break beyond the triangle’s boundaries; a close outside these lines increases reliability. |
| Volume Surge on Breakout | A marked increase in trading volume during the breakout emphasizes the strength and conviction behind the move. |
| Technical Indicator Confirmation | Bullish or bearish divergences on oscillators (like RSI or MACD) during the pattern’s formation can provide additional context and validation. |
| Re-test of Triangle Boundary | After the breakout, price often revisits the triangle’s boundary. A successful re-test that respects the boundary as new support or resistance can be a powerful confirmation of the breakout’s legitimacy. |
Using these tools in combination can help traders discern genuine breakouts from false ones, ensuring a higher probability of trading success when working with the symmetrical triangle pattern.
Trading Essentials for the Symmetrical Triangle Pattern
- Best Timeframe: The symmetrical triangle is versatile and can appear on various timeframes, but it’s most reliable and pronounced on the 1-hour to daily charts. This provides a balance between precision and significance of the pattern.
- Trading Session: The breakout’s authenticity is often best judged during the primary trading session of the asset in question (e.g., U.S. session for USD pairs), as this is when volume and liquidity are at their peak, making false breakouts less likely.
- Winning Ratio: With proper confluence factors and disciplined risk management, trading the symmetrical triangle can yield a winning ratio of approximately 65-70%. However, it’s crucial to factor in the overall market context and the asset’s prevailing trend.
By keeping these key considerations in mind, traders can navigate the intricacies of the symmetrical triangle pattern with greater confidence and efficacy.
Symmetrical Triangle Trading Strategy with Confluence
1. Entry Strategy:
- Primary Entry Point: Consider going long on a confirmed upward breakout or short on a downward breakout from the triangle.
- Confluence Factors for Entry: Additional factors like bullish or bearish candlestick patterns near the breakout, a supportive moving average, or a confirming signal from oscillators (such as the RSI or MACD) can provide stronger signals for entry.
2. Stop-Loss Placement:
- Position your stop-loss just below the lowest point of the triangle for a long trade or just above the highest point for a short trade. This ensures minimal exposure if the pattern doesn’t play out as expected.
3. Take Profit Level:
- Measure the widest part of the triangle and project this distance from the breakout point, giving a potential price target. For added granularity, consider scaling out or taking partial profits at significant resistance (for long trades) or support levels (for short trades).
Conclusion:
The symmetrical triangle is a powerful pattern that highlights periods of market consolidation and impending volatility. When combined with additional confluence factors, its predictive power increases, offering traders a structured approach to capitalize on potential breakouts. As with all trading strategies, maintaining rigorous risk management and staying adaptive to evolving market conditions is crucial.

