Definition:
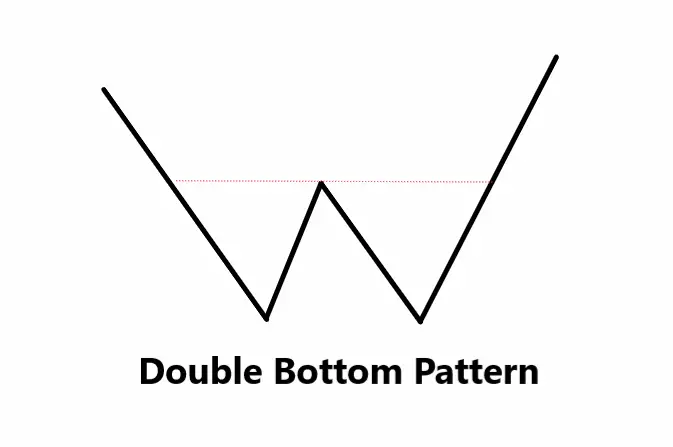
The double bottom pattern is a bullish reversal chart pattern marked by two distinct troughs at roughly equal price levels. Signifying a transition from bearish to bullish momentum, the double bottom serves as a key alert for traders anticipating a market turnaround.
Identifying the Double Bottom Pattern on the Chart
- Prolonged Downtrend: Before the formation, there should be evidence of a significant downtrend.
- First Bottom Formation: The price creates a notable low, which will represent the first bottom.
- Intermediate Peak: Following the first bottom, there’s a price rebound that establishes a peak, often referred to as the “neckline.”
- Second Bottom Formation: After the rebound, the price drops again to form a second bottom. This should be roughly at the same price level as the first, indicating a strong support level.
- Break Above Neckline: For the pattern to be confirmed, the price should subsequently rise and break above the neckline formed by the intermediate peak.
- Volume Analysis: Ideally, the volume should decrease during the formation of the second bottom and increase during the breakout above the neckline, solidifying the pattern’s validity.
Significance and Indications of the Double Bottom Pattern
- Reversal Indicator: At its core, the double bottom is a stark indication of a shifting market sentiment. After a sustained downtrend, this pattern signals the potential exhaustion of the bears and the emerging dominance of the bulls. The two bottoms serve as evidence that a particular price level is offering strong support, resisting any further downward pressure.
- Predictability and Risk Management: For traders, the symmetry and structure of the double bottom pattern provide clear points of reference. The well-defined troughs offer precise levels for trade entries and setting stop-losses. This clarity allows traders to establish positions with a calculated risk-to-reward ratio, a cornerstone for successful trading.
- Volume Confirmation: One of the standout features of the double bottom is its relationship with trading volume. A decrease in volume at the second trough followed by a surge during the neckline breakout adds further credence to the pattern. This interplay between price and volume serves as a robust confirmation tool, giving traders added confidence in their forecasting.
- Forecasting Potential: Beyond signaling a trend reversal, the double bottom can also provide insights into the potential length and strength of the ensuing bullish trend. By measuring the depth of the pattern (distance between the neckline and the bottoms), traders can project price targets, offering a roadmap for both short-term and swing traders.
Activity of Big Traders During the Double Bottom Formation
In the intricate dance of the markets, the double bottom pattern often provides a window into the maneuvers of institutional or “big” traders. Understanding their activity during this formation can be a game-changer for retail traders.
- Accumulation Phase: The first trough of the double bottom can be seen as a point of interest where institutional traders identify a value proposition. Their initial buy orders at this stage prevent the price from plunging further, leading to the formation of the first bottom.
- Testing the Waters: As prices rebound and then come back down for the second trough, institutional traders are essentially “testing the waters.” They want to ascertain that the price level of the first trough is a genuine support level, and they’ll defend it again. This second confirmation provides a more concrete evidence of their bullish sentiment and commitment to the price level.
- Bolstering Momentum: As the price approaches the neckline after the second trough, big traders typically ramp up their buying activity. Their large volume purchases, often detectable through a surge in trading volume, help propel the price through the neckline, triggering the bullish reversal.
- Positioning Ahead of Retail: Institutional players often anticipate the pattern formation and position themselves ahead of retail traders. By the time the majority of retail traders recognize the pattern and respond, big traders are already positioned favorably, capitalizing on the subsequent price appreciation.
In essence, for the discerning eye, the double bottom pattern unveils a narrative of big traders’ strategic positioning, offering retail traders insights to align their trades with the market movers.
Confirmation Tools for the Double Bottom Pattern
| Tool | Description |
|---|---|
| Key Level Break | A robust breakout above the neckline serves as a primary confirmation of the pattern’s validity. |
| Break of Previous Low | Post-pattern, no new lows should form. The absence of a new low confirms the strength of the reversal. |
| High Volume Surge | An increase in trading volume during the neckline breakout emphasizes the momentum behind the reversal. |
| Technical Indicator Divergence | Bullish divergences on oscillators (e.g., RSI or MACD) can further validate the pattern’s bullish implications. |
Key Considerations for Trading the Double Bottom Pattern
- Best Timeframe: For optimal clarity and reliability, the daily and 4-hour charts are most favored when spotting the double bottom pattern.
- Trading Session: While the pattern is universally applicable, its significance is heightened during the main trading session of the instrument in question, ensuring higher liquidity and pattern validity.
- Winning Ratio: With proper confirmation and disciplined risk management, traders can anticipate an approximate winning ratio of 70% when trading the double bottom pattern.
Trading Strategy with Confluence for the Double Bottom Pattern
1. Entry Strategy:
- Primary Entry Point: Enter a long position when there’s a confirmed breakout above the neckline.
- Confluence Factors to Consider: Look for additional confirmation tools such as a bullish divergence in an oscillator (like RSI or MACD), a significant increase in volume during the breakout, or a preceding bullish candlestick pattern.
2. Stop-Loss Placement:
- Set the stop-loss just below the second bottom. This ensures that if the pattern fails and a new low is created, the position is exited with minimal loss.
3. Take Profit Level:
- Calculate the distance (height) between the neckline and the bottoms. Project this distance upwards from the breakout point at the neckline. This projection gives a potential price target.
- For added precision, consider taking partial profits at significant resistance levels or when encountering bearish reversal patterns.
Conclusion:
The double bottom pattern is a potent tool in a trader’s arsenal, signaling a potential bullish reversal after a downtrend. When combined with confluence factors, its predictive power increases, providing traders with a structured and methodical approach to capitalize on emerging bullish momentum. However, as with all trading strategies, it’s imperative to use proper risk management and remain adaptable to evolving market conditions.

