Definition:
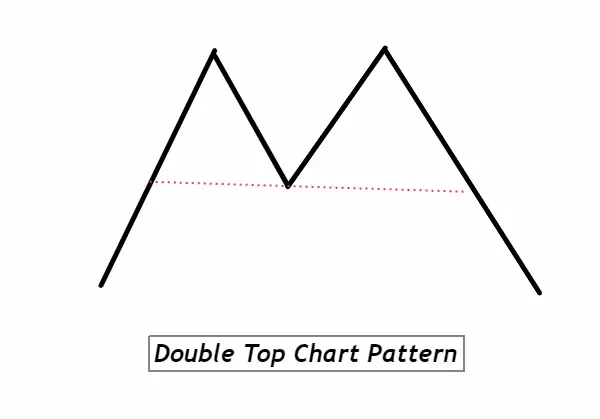
A double top chart pattern is a bearish reversal pattern characterized by two consecutive peaks that are roughly equal, with a moderate trough in-between, indicating potential trend exhaustion. Often spotted after a sustained uptrend, the double top signals potential reversal as bullish momentum wanes, presenting traders an opportunity to position defensively or consider short-selling.
How to Identify the Double Top Chart Pattern on the Chart:
- Prior Uptrend: Before the formation of a double top, there should be a noticeable uptrend. This sets the stage for the pattern and gives it context as a reversal signal.
- First Peak: The initial peak is formed when the price reaches a new high and then declines.
- Trough Formation: After the first peak, the price will pull back to form a trough. This trough is essential as it acts as a separation between the two peaks. The depth of the trough can vary, but it should not exceed the price level of the prior uptrend’s starting point.
- Second Peak: Following the trough, the price will rise again to form the second peak. This peak should be roughly at the same level as the first peak. Minor variations in height are acceptable, but they should be approximately equal.
- Decline from Second Peak: After the second peak is formed, a decline in price should be observed. This confirms the bearish reversal signal of the pattern.
- Support Break: For the pattern to be confirmed, the price should break below the trough’s support level. This breach often leads to a further decline, signaling a complete trend reversal.
- Volume Confirmation: While not always necessary, volume can provide extra validation. Ideally, volume should decrease during the formation of the second peak and increase as the price breaks below the trough’s support.
By recognizing these points on a chart, traders can efficiently identify the double top pattern and make informed trading decisions based on its bearish implications.
Significance of the Double Top Chart Pattern:
1. Reversal Signal: The primary significance of the double top pattern is its role as a bearish reversal signal. After a prolonged uptrend, the appearance of this pattern indicates that the bullish momentum is waning. The two peaks signify two attempts by buyers to push prices higher, and their failure to sustain the rally a second time suggests that the sentiment might be shifting in favor of the bears.
2. Predictive Power & Trade Planning: For traders, the double top can be a precursor to a more extended downward move. Once the pattern is confirmed—especially with the price breaking below the trough’s support level—it provides a clear area of risk management. Traders can set stop-loss orders just above the second peak, ensuring minimized losses if the pattern doesn’t play out as expected. The defined structure of the pattern aids traders in forecasting potential price targets to the downside.
3. Volume Considerations: The volume dynamics during the formation of a double top can offer additional insights. A decrease in volume at the second peak compared to the first can suggest a lack of conviction from the buyers. Conversely, an increase in volume during the breakdown below the trough’s support level can affirm the bearish reversal, giving traders additional confidence in their bearish bets.
4. Broad Applicability: While commonly seen in stock markets, the double top pattern’s principles apply across various financial markets, from commodities to forex. Its universal recognition and reliability make it an invaluable tool for traders of all experience levels, aiding in both trade execution and risk management.
Big Traders’ Activity During the Formation of the Double Top Pattern:
1. Distribution Phase: Often, the formation of the double top can coincide with what’s known in trading as the distribution phase. Big traders, or “smart money,” who have accumulated positions during the prior uptrend, start offloading or reducing their holdings. The first peak in the pattern can be seen as the initial wave of this distribution, where these institutional players begin to sell into the strength of the market, taking profits off the table.
2. Failed Second Attempt: As prices retrace and move up for the second peak, this isn’t typically driven by the same strong conviction or institutional buying that marked the prior uptrend. Instead, it may be driven by retail traders or those who missed the initial move. Smart money recognizes this lack of momentum and strength, and they continue or even accelerate their distribution. This further selling by big traders solidifies the formation of the second peak.
3. The Breakdown: The trough or the neckline between the two peaks acts as a crucial support level. Once the price starts moving towards this level after the formation of the second peak, institutional traders might amplify their selling activity, often pushing prices below this critical support. The breach of this level, especially on high volume, is a strong indication that the smart money has shifted its bias from bullish to bearish.
4. The Role of Volume: A discerning eye on volume can provide retail traders with insights into the activities of big players. Decreasing volume during the formation of the second peak, followed by increasing volume during the price decline, signals the shift in momentum and the likely presence of institutional selling.
For retail traders, understanding these behind-the-scenes activities offers an edge. It emphasizes the importance of not just relying on the chart’s visual patterns but also seeking to understand the underlying dynamics and market psychology driving those patterns. By aligning themselves with the actions of the big traders, retail traders can navigate the markets with increased confidence and precision.
High Probability Confirmation Tools for the Double Top Pattern
| Tool | Description |
|---|---|
| Key Resistance Level | Ensure the peaks align with a significant resistance level. This adds validity to the pattern and shows that the price is struggling to break past a known barrier. |
| Break of Low (Trough) | A decisive break below the trough or neckline post-pattern formation is a primary confirmation signal. If prices close below this level, it often indicates a strong likelihood of a continued downward move. |
| Volume Dynamics | High volume during the breakdown (below the trough) and comparatively lower volume at the second peak suggest institutional selling and less buyer interest respectively, adding weight to the reversal confirmation. |
| Technical Indicators | Utilize oscillators like the RSI (Relative Strength Index) or MACD (Moving Average Convergence Divergence). For instance, bearish divergence on the RSI during the second peak can further confirm weakening bullish momentum. |
Leveraging these tools in conjunction with the double top pattern can provide traders with a more nuanced and high-probability trading approach, increasing the odds of successful trade outcomes.
Optimal Conditions for Trading the Double Top Pattern
Best Timeframe: The daily timeframe (D1) is often considered ideal for identifying the double top pattern, as it filters out intra-day noise and offers a clearer view of the market’s broader trend and potential reversals.
Trading Session: For forex traders, the overlap of the London and New York sessions (8:00 AM – 12:00 PM EST) provides the highest liquidity and volatility, making it a favorable window to spot and trade this pattern.
Winning Ratio: While the exact win rate can vary based on other confluence factors and the trader’s strategy, experienced traders often report a winning ratio between 60-70% when the double top pattern is combined with the aforementioned confirmation tools.
Understanding these optimal conditions can further enhance the effectiveness and reliability of trading based on the double top pattern.
Double Top Trading Strategy with Confluence
1. Entry:
- Await confirmation of the double top pattern, characterized by two equal peaks and a trough in-between.
- Look for confluence factors, such as bearish divergence on RSI or a key resistance level aligning with the peaks.
- Enter a short trade after a decisive break and close below the trough or neckline, ensuring that the breakdown is supported by increased volume.
2. Stop Loss:
- Place the stop loss slightly above the highest point of the second peak. This ensures that the trade remains valid within the pattern’s framework and provides protection if the price unexpectedly rallies.
3. Take Profit:
- Calculate the vertical distance from the neckline to the peaks. This distance can then be extrapolated downwards from the neckline to set a price target.
- Alternatively, monitor other support levels or use trailing stops to capitalize on potentially longer bearish moves while protecting profits.
Conclusion:
The double top pattern is a powerful bearish reversal signal that, when combined with confluence factors, can significantly enhance trading precision. While the pattern provides a structured approach to entry, stop loss, and profit-taking, traders should remain adaptive, considering the broader market context. Recognizing the underlying dynamics, aligning with significant market players, and using additional confirmation tools can make the double top an indispensable pattern in a trader’s toolkit.

