Definition:
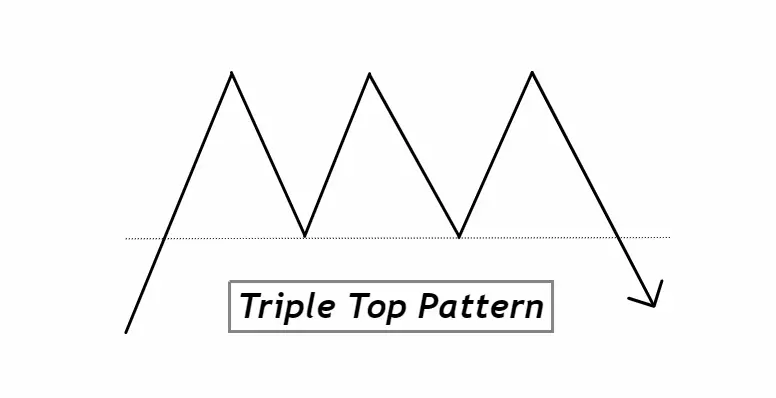
Triple Top Pattern is a bearish reversal chart formation characterized by three distinct peaks at roughly the same price level, following an uptrend. The Triple Top Pattern signals potential trend exhaustion, indicating that the asset may transition from a bullish to a bearish trajectory.
How to Identify the Triple Top Pattern on a Chart:
- Uptrend Precedence: Before the formation of the Triple Top, there should be a clear uptrend in place. This sets the stage for a potential reversal.
- Three Peaks: Look for three distinct peaks that form at approximately the same price level. These are the “tops” and are crucial to this pattern.
- Equal Heights: The peaks should be of roughly equal height, with only minor variations in price.
- Volume Consideration: Volume typically diminishes at each successive peak. This can be a sign of decreasing buying interest and hints at the upcoming bearish reversal.
- Support Level (Neckline): Beneath the peaks, there should be a noticeable support level. Once this support is breached, it’s a strong confirmation of the pattern’s completion and a potential signal to sell or short.
- Time Between Peaks: The tops should be spaced out and not too close together. This ensures the pattern isn’t rushed and has time to develop.
- Breakout: For confirmation of the pattern, traders often wait for the price to break below the neckline (support level) on increased volume.
By paying attention to these points, traders can more easily identify the Triple Top Pattern on charts and make informed trading decisions based on its implications.
Significance and Indications of the Triple Top Pattern:
1. Trend Reversal Insight: The Triple Top Pattern is of paramount significance as it signals a potential end to an existing bullish trend. When traders observe this formation, they are essentially witnessing the market’s waning confidence in the prevailing upward momentum. The pattern’s three peaks symbolize repeated attempts by the bulls to push the asset higher, and their subsequent failures serve as a cautionary tale of trend exhaustion.
2. Predictive Power with Confirmation: For traders, the true power of the Triple Top is in its predictive ability post-confirmation. When the price breaks below the established neckline—especially on increased volume—it serves as a robust signal of a bearish reversal. This confirmation can guide traders in timing their exits from long positions or initiating short positions, allowing them to capitalize on potential downtrends.
3. Risk Management Tool: Recognizing the Triple Top Pattern assists traders in establishing clear risk management protocols. By gauging the distance between the tops and the neckline, traders can determine potential price targets for the ensuing bearish move. Additionally, placing stop-loss orders slightly above the pattern’s peaks ensures limited downside risk while capitalizing on the pattern’s bearish implications.
4. A Pattern of Patience: The Triple Top serves as a reminder of the importance of patience in trading. Rather than rushing to conclusions on seeing two tops, waiting for the third and the subsequent break of the neckline can provide more reliable, high-probability trading signals. This patience often translates to more consistent trading outcomes and reinforces the importance of letting patterns fully form before acting.
In essence, for both new and experienced traders, the Triple Top Pattern offers invaluable insights into potential market shifts, providing both predictive power and critical risk management cues.
Activity of Big Traders During the Formation of the Triple Top Pattern:
1. Initial Optimism: The first peak in a Triple Top Pattern typically reflects the sentiment of institutional and large traders still being bullish. At this point, big players are often accumulating or holding onto their positions, expecting the asset’s price to break higher. Retail traders often see this as a continuation of the bullish trend and might join in the buying.
2. Waning Confidence: As the second peak forms, the market experiences resistance again at a similar level. Behind the scenes, big traders may start to doubt the sustainability of the uptrend. They might reduce their position sizes, hedge, or even initiate slight selling. The market’s inability to set a new high signals to these institutional participants that buying momentum could be running out.
3. Confirmation of Bearish Outlook: By the time the third peak is in formation, institutional traders often interpret this repeated failure to breach the resistance as a sign of impending trend reversal. Sensing this, they may begin to offload larger portions of their positions, or even start establishing short positions in anticipation of a bearish move. The price’s inability to break through the resistance for the third time might be a result of significant distribution by these big players.
4. The Break of the Neckline: When the price breaks below the neckline, it’s often not just the result of retail selling. Big traders and institutions, having witnessed the triple failure at the resistance, may accelerate their selling or increase their short positions, reinforcing the bearish move. This activity, especially when accompanied by increased volume, provides a clearer indication of their bearish stance.
For retail traders, understanding these dynamics is crucial. The Triple Top isn’t just a chart pattern; it’s a narrative of shifting sentiment among market movers. By recognizing the actions and intentions of institutional traders behind the pattern, retail traders can align their strategies with the dominant market forces, increasing their chances of successful forecasting and trading.
Triple Top Pattern Confirmation Table
| Confirmation Tool | Description |
|---|---|
| 1. Key Resistance Level | Ensure the three tops occur at or near a well-established resistance level. This emphasizes the struggle of the price to break through, reinforcing the pattern’s validity. |
| 2. Break of Neckline (Support Level) | A decisive breach below the neckline, particularly when it’s a significant support level, strongly signals the pattern’s completion and potential for a bearish continuation. |
| 3. Increased Volume on Breakdown | A spike in volume when the price breaks below the neckline suggests strong selling momentum and participation, adding conviction to the bearish reversal. |
| 4. Confirmatory Technical Indicators | Utilize indicators like the Moving Average Convergence Divergence (MACD) or Relative Strength Index (RSI) to corroborate bearish divergence or momentum shifts in conjunction with the pattern formation. |
For traders, this table can serve as a checklist. When multiple tools align with the Triple Top Pattern, it enhances the probability of the pattern’s authenticity and the subsequent bearish reversal.
Triple Top Trading Guidelines
Best Timeframe: For optimal clarity and reliability, the Daily (1D) timeframe is often favored by traders when analyzing the Triple Top Pattern. This timeframe reduces the noise of shorter intervals and allows for a better overview of the pattern’s formation.
Trading Session: The most liquid trading sessions, such as the New York and London overlap, provide the best environments. During these times, price action is clearer due to higher volume and volatility, enhancing the credibility of the pattern’s formation.
Approximate Winning Ratio: While the exact success rate can vary based on the overall market conditions and individual assets, a well-confirmed Triple Top Pattern typically offers a winning ratio in the range of 60-70%. As always, traders should use additional confluences and risk management techniques to enhance their odds further.
Triple Top Confluence Trading Strategy
Entry: Once the Triple Top Pattern is identified, wait for a decisive break below the neckline. To add confluence, ensure this break is accompanied by other confirming signals such as increased volume or bearish divergence on momentum indicators like MACD or RSI. Enter a short position when these factors align.
Stop Loss: Set the stop loss slightly above the highest peak of the Triple Top Pattern. This ensures that if there is a false breakout and price reverts back to test the resistance, your position is protected.
Take Profit Level: Determine the vertical distance between the neckline and the peaks. Project this distance downward from the breakout point at the neckline to set a target for the potential bearish move. This provides a logical take profit level based on the pattern’s inherent structure.
Conclusion:
The Triple Top Pattern serves as a powerful tool in a trader’s arsenal, signaling potential bearish reversals after a sustained uptrend. By integrating additional confluences and adhering to a clear strategy for entry, stop loss, and take profit, traders can harness the predictive power of this pattern while managing risk effectively. As always, practice and experience combined with rigorous risk management will enhance the success of trading based on the Triple Top Pattern.

