Definition:
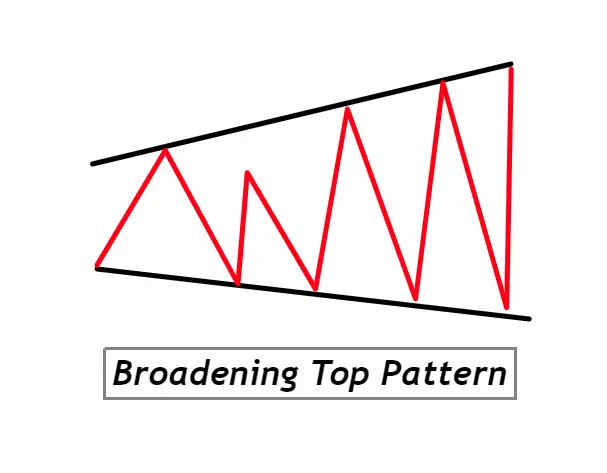
The Broadening Top Pattern is a bearish reversal chart formation characterized by diverging trendlines connecting higher highs and lower lows, indicating increasing volatility and potential trend change. Typically observed after an uptrend, the Broadening Top Pattern signals potential market uncertainty and weakening of the prevailing trend, alerting traders to anticipate a possible bearish shift.
How to Identify the Broadening Top Pattern on a Chart:
- Uptrend Precedence: Start by ensuring the pattern is forming after a notable uptrend. This context sets the stage for a potential reversal.
- First Peak: Look for the formation of a peak (high). This is the beginning of the pattern.
- First Trough: After the first peak, there should be a decline to form a trough (low). This low should be lower than the start of the uptrend.
- Second Peak: Following the trough, there will be a rise that forms a second peak, which should be higher than the first peak.
- Second Trough: After the second peak, another decline forms a second trough, which should be lower than the first trough.
- Diverging Trendlines: Draw two trendlines: one connecting the peaks and the other connecting the troughs. These lines should be moving away from each other, indicating the broadening aspect of the pattern.
- Increasing Volatility: The distance between the highs and lows should be expanding, indicating a rise in volatility and market uncertainty.
- Volume Confirmation: While not mandatory, it can be beneficial to observe volume. Often, there’s an increase in volume as the pattern develops, especially during the breakout.
- Breakout: The pattern’s completion is usually confirmed when the price breaks below the support trendline formed by the troughs, signaling the reversal.
Significance and Indications of the Broadening Top Pattern:
1. Forecasting a Reversal: One of the most significant attributes of the Broadening Top Pattern is its ability to signal a potential bearish reversal after a prolonged uptrend. For traders, this can be invaluable as it offers an early warning sign to either exit long positions or prepare to take short positions.
2. Highlighting Market Uncertainty: The diverging trendlines, representing higher highs and lower lows, are indicative of increasing volatility and market indecision. This expanding volatility implies that the market participants are becoming increasingly divided in their outlook. Recognizing such periods of heightened uncertainty allows traders to adjust their strategies accordingly, potentially favoring more flexible or conservative approaches.
3. Volume as a Confirmation Tool: While the pattern itself is a powerful indicator, its reliability can often be enhanced when combined with volume analysis. An increase in trading volume, especially during the breakout, adds weight to the pattern’s bearish prediction. For traders, volume can serve as an added layer of confirmation, ensuring they’re not just acting on a false breakout.
4. Strategic Entry and Exit Points: Beyond just signaling a potential trend reversal, the Broadening Top Pattern also provides traders with clear boundaries for setting stop-losses and profit targets. For instance, a break below the support trendline can be an ideal point for short entry, while the previous trough can act as a strategic location for a stop-loss.
In essence, for both new and seasoned traders, the Broadening Top Pattern serves as a beacon in the often murky waters of market analysis, providing clarity, direction, and actionable insight into potential future price movements.
Activity of Big Traders During the Formation of the Broadening Top Pattern:
1. Distributive Action: When a Broadening Top Pattern begins to take shape after a sustained uptrend, it often signals that large institutional players (often termed “smart money” or “big traders”) are starting a distributive phase. This means they are beginning to offload or distribute their positions to the retail public. The higher highs in the pattern can sometimes be a result of these big traders pushing prices up temporarily to achieve better sell prices, taking advantage of the bullish sentiment that previously prevailed.
2. Inducing Retail FOMO: The ever-widening pattern, with its higher highs, can induce a sense of ‘Fear of Missing Out’ (FOMO) among retail traders. They might interpret these highs as a continuation of the bull market, not recognizing the underlying distribution taking place. The smart money leverages this sentiment, selling their positions to late-comers eager to join the perceived uptrend.
3. Increasing Volatility and Uncertainty: The alternating higher highs and lower lows (a hallmark of this pattern) indicate growing uncertainty in the market. This seesaw action can be a result of big traders strategically offloading significant positions, which impacts price. They might also be employing tactics to shake out weaker hands – pushing the price down sharply to trigger stop losses of retail traders, only to push it up again.
4. Breakout as the Final Cue: As the pattern concludes and a breakout below the support trendline occurs, it’s often the final indication that big traders have sufficiently offloaded their positions and are now letting the market find its new equilibrium. This breakout, especially if accompanied by high volume, signals the culmination of the distribution phase and the dominant control of bearish sentiment.
In summary, understanding the behind-the-scenes activity of large institutional traders during the formation of a Broadening Top Pattern provides retail traders with a more holistic view of market dynamics. By recognizing the tactics and strategies of big players, retail traders can better navigate the market, making more informed and strategic decisions.
Broadening Top Pattern Confirmation Table:
| Confirmation Tool | Description and Significance |
|---|---|
| 1. Key Support and Resistance Levels | Before a breakout occurs, identifying major support and resistance levels can provide clarity on potential reversal points. A break below a significant support level post-pattern formation can strongly confirm the pattern’s bearish implications. |
| 2. Break of the Last Low | A clear and decisive break below the last established low within the pattern (the lowest trough) often solidifies the bearish reversal signal. It indicates that the sellers have gained significant control over the market dynamics. |
| 3. High Volume on Breakout | A surge in volume during or post pattern formation, especially at the point of breakout, underscores the strength of the bearish reversal. High volume indicates strong participation and consensus among market participants about the new direction. |
| 4. Momentum Indicators | Tools like the Moving Average Convergence Divergence (MACD) or the Relative Strength Index (RSI) can provide additional confirmation. For instance, bearish divergences on these indicators while the pattern forms can reinforce the reversal prediction. |
By incorporating these tools into their analysis, traders can achieve a higher probability of accurately forecasting the market’s direction following a Broadening Top Pattern formation.
Trading Insights for the Broadening Top Pattern:
Best Timeframe: For optimal clarity and reliability, the Daily timeframe (1D) is often preferred when trading the Broadening Top Pattern. It strikes a balance, capturing the pattern’s development while filtering out minor intraday noises.
Trading Session: The pattern’s significance is heightened during the primary trading hours of the respective market (e.g., NYSE hours for U.S. stocks). This ensures higher liquidity and better price movement representation.
Winning Ratio: While the Broadening Top Pattern is a powerful reversal indicator, no pattern guarantees success. On average, with proper confirmation and risk management, traders might expect a winning ratio of approximately 60-70%. However, this figure can vary based on market conditions and individual trading strategies.
It’s essential to always incorporate sound risk management practices and not solely rely on pattern-based probabilities.
Broadening Top Pattern Trading Strategy with Confluence:
1. Entry: Wait for the price to break below the support trendline of the pattern. To add confluence, ensure this breakout aligns with other bearish indications – perhaps a key support level being breached or a bearish crossover on a momentum indicator like MACD.
2. Stop Loss: Place the stop loss just above the last low (trough) within the pattern. This area typically acts as resistance once broken. By placing the stop loss here, you’re ensuring minimal losses if the pattern fails and price reverses.
3. Take Profit Level: One approach is to measure the height of the pattern at its widest point and project that distance downwards from the breakout point. This gives an approximate target for where the price might go. However, to add confluence, consider also aligning your take profit with major support levels or Fibonacci retracement levels.
Conclusion:
The Broadening Top Pattern is a valuable tool in a trader’s arsenal, indicating potential bearish reversals in the market. By incorporating elements of confluence, the pattern’s reliability can be enhanced, offering traders more confidence in their decisions. However, like all trading strategies, it’s essential to apply proper risk management and continuously evaluate the strategy’s effectiveness in varying market conditions.

